

مع نمو شركات SaaS السعودية، يصبح تتبع الإيرادات المتكررة أكثر صعوبة عندما تعمل أنظمة المبيعات والمالية والفوترة وإعداد التقارير بشكل منفصل. وغالبًا ما تواجه الفرق صعوبات تتمثل في تأخر التنبؤات، وعدم اتساق تقارير معدل فقدان العملاء، وارتفاع تكاليف اكتساب العملاء، وسير العمل المعتمد بشكل كبير على جداول البيانات، مما يقلل من وضوح الرؤية عبر الأقسام.
وفقًا لـالاستطلاع العالمي التاسع والعشرين للرؤساء التنفيذيين من PwC، يتوقع 71% من قادة الأعمال في السعودية نمو الإيرادات خلال السنوات الثلاث المقبلة، مما يزيد الحاجة إلى تحسين التنبؤات، والرؤية التشغيلية، وعمليات إعداد التقارير القابلة للتوسع.
تساعد مقاييس كفاءة مبيعات SaaS الشركات على قياس مدى استدامة النمو وربحيته وإمكانية إدارته تشغيليًا. وتوفر مقاييس مثل تكلفة اكتساب العميل (CAC)، والقيمة الدائمة للعميل (LTV)، والإيرادات الشهرية المتكررة (MRR)، ومعدل فقدان العملاء، وسرعة المبيعات رؤية أوضح حول كفاءة اكتساب العملاء، وأداء الاحتفاظ بهم، وقابلية التنبؤ بالإيرادات.
وبالنسبة للشركات السعودية النامية، تزداد أهمية فهم هذه المقاييس لتحسين دقة التقارير، وتقليل النقاط العمياء التشغيلية، ودعم اتخاذ قرارات مالية أفضل.
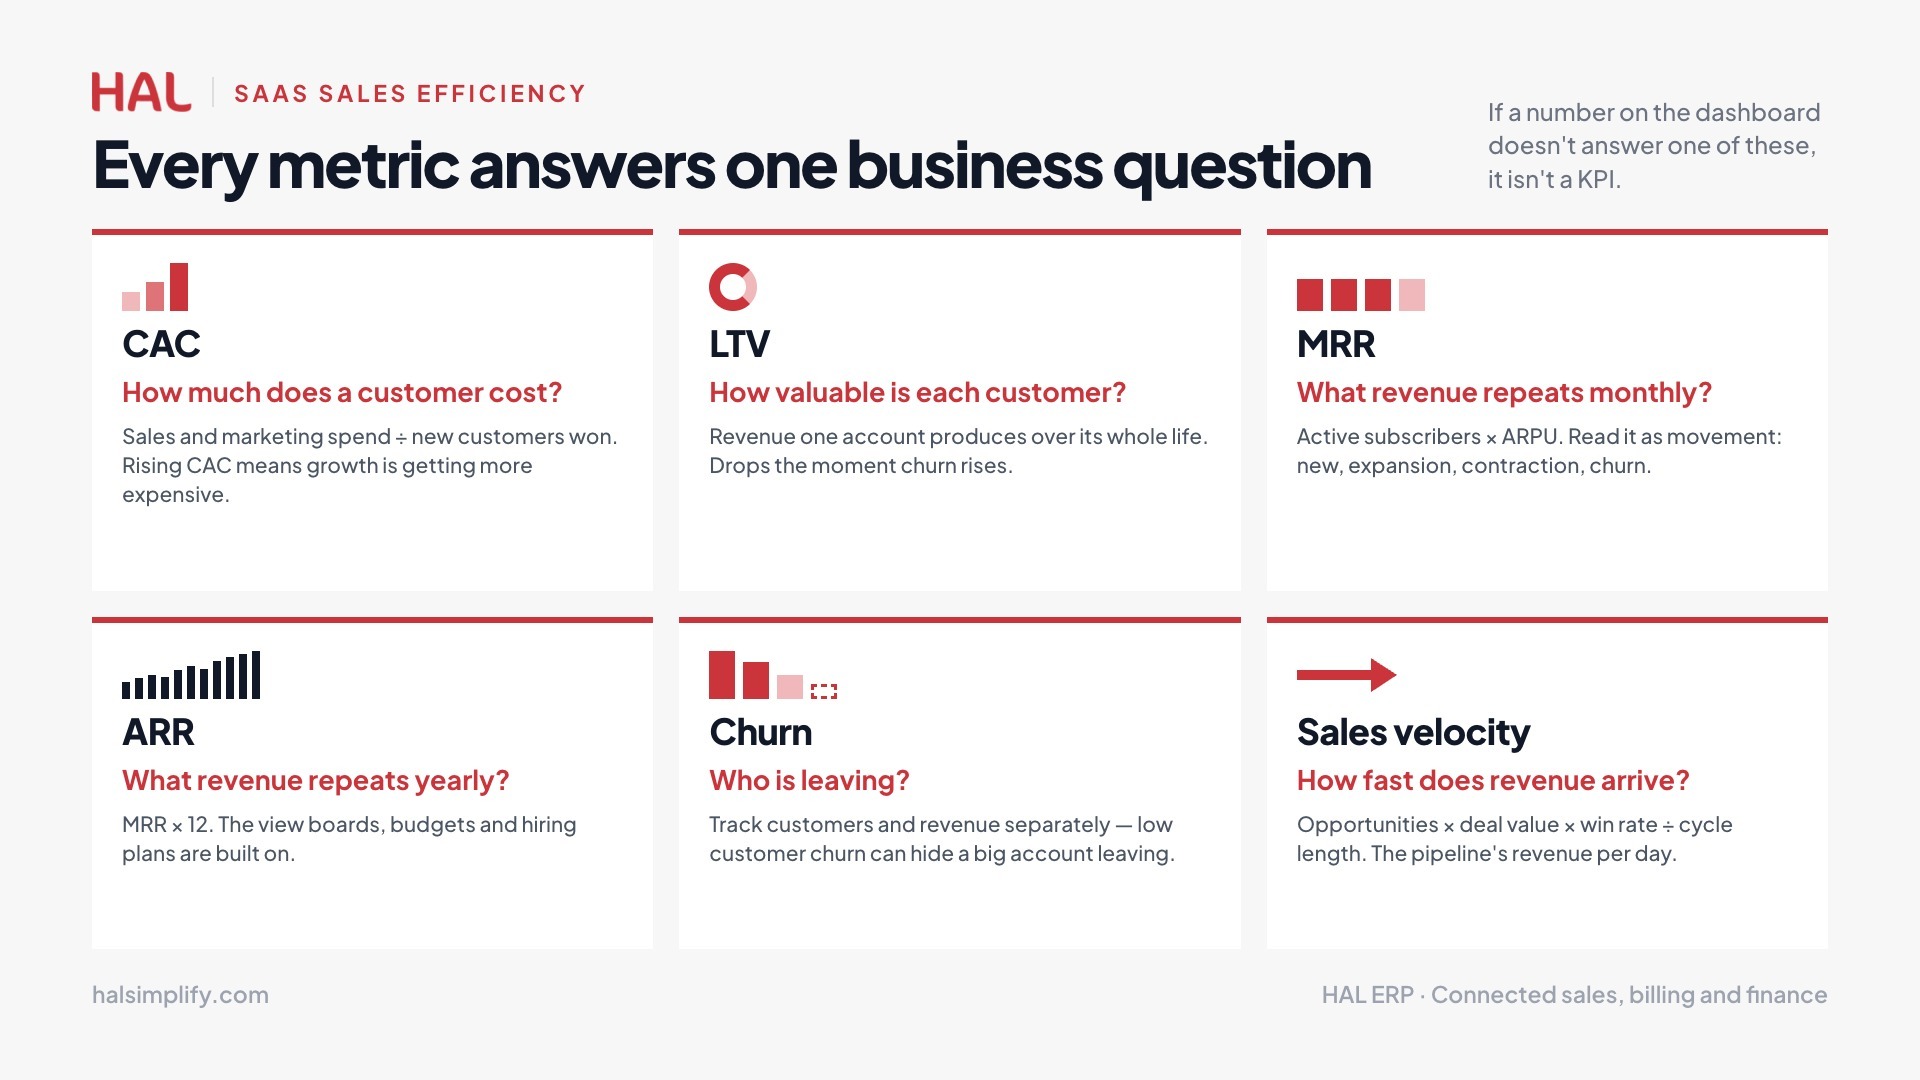
تقيس مقاييس كفاءة مبيعات SaaS مدى فعالية عمليات المبيعات والإيرادات في تحقيق إيرادات متكررة، وتشمل اكتساب العملاء، والتحويل، والاحتفاظ بالعملاء، وإنتاجية المبيعات بشكل عام. وبالنسبة لشركات SaaS النامية، تؤثر هذه الأرقام بشكل مباشر في التنبؤات والميزانيات والتوظيف والتخطيط التشغيلي، وليس فقط في إعداد التقارير.
وتستمد هذه المقاييس بياناتها من أنظمة CRM ومنصات الفوترة وأدوات المالية ولوحات معلومات المبيعات، وتشمل مؤشرات مثل:
وبشكل جماعي، تكشف هذه المؤشرات ما إذا كان أداء المبيعات يتوسع بشكل مستدام أو أصبح من الصعب تحقيق نمو إضافي.
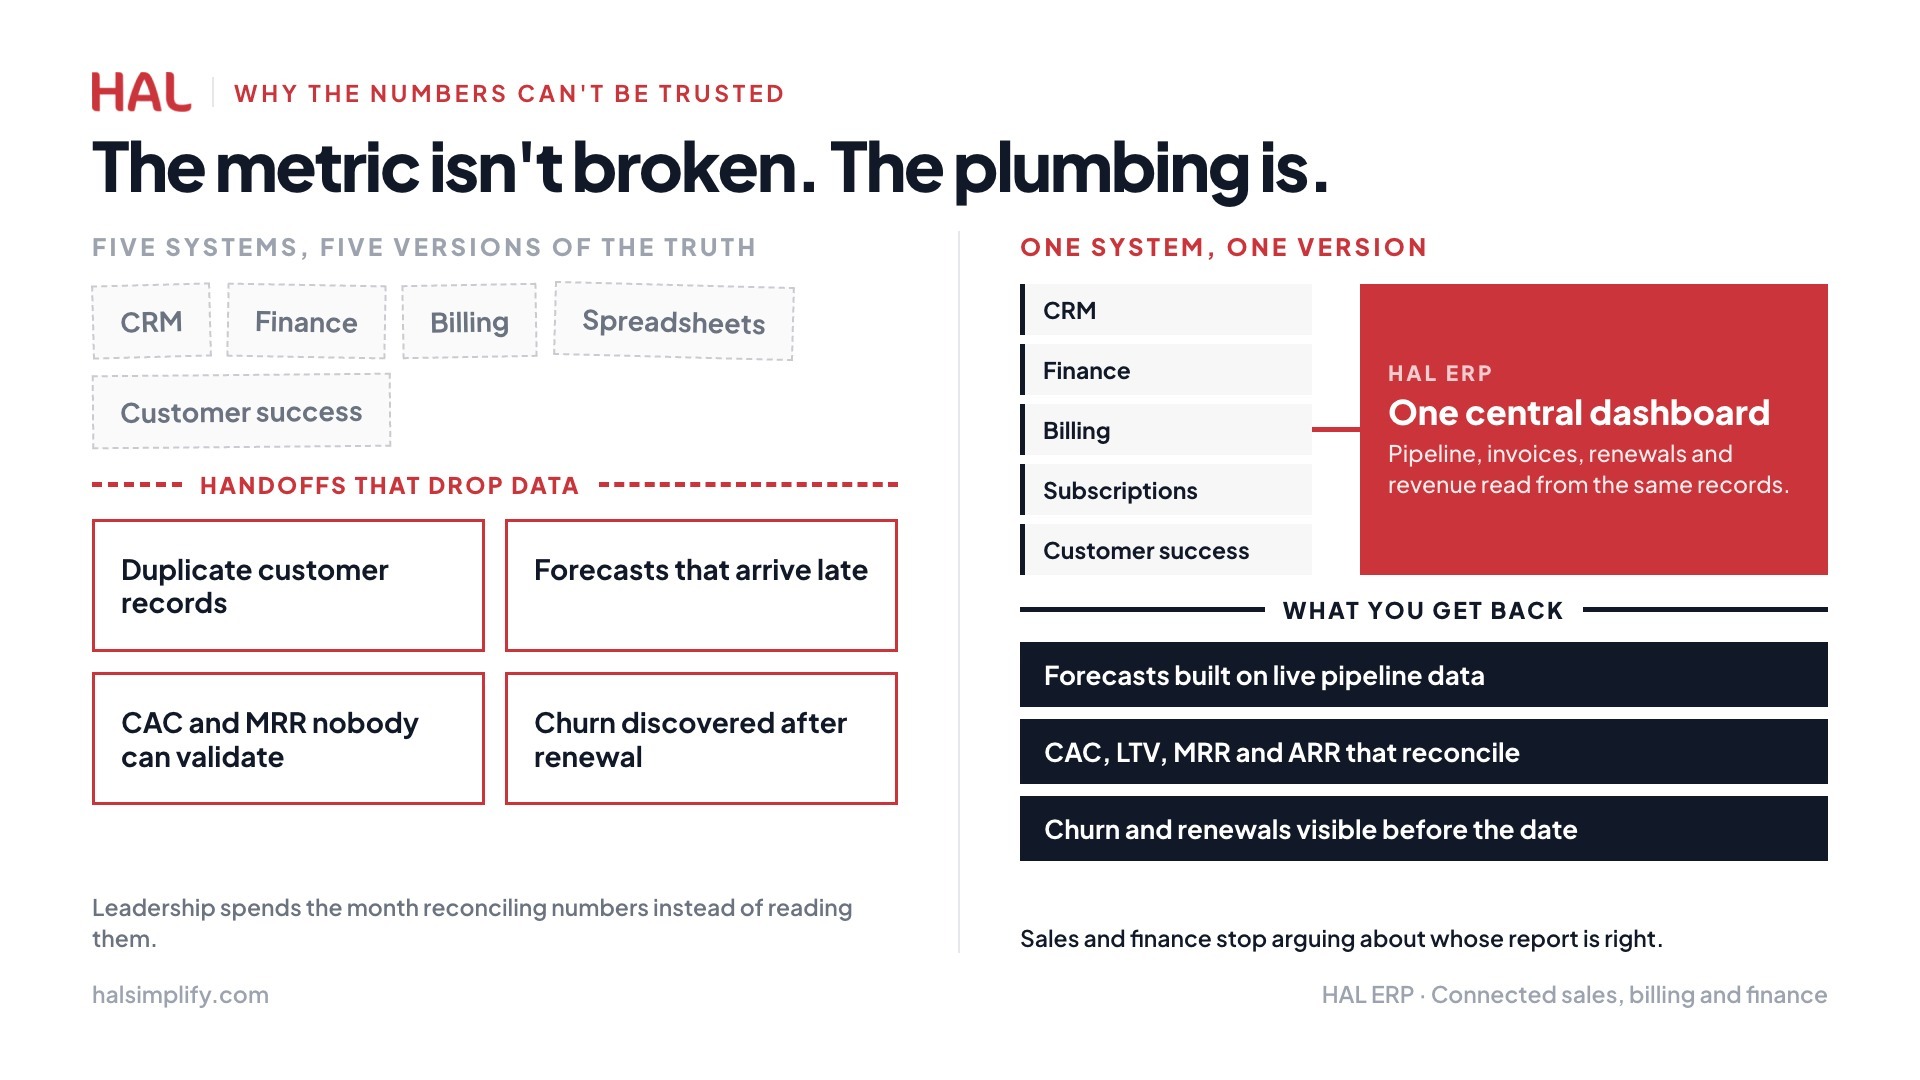
تعتمد العديد من شركات SaaS على أنظمة منفصلة بين المبيعات والمالية والفوترة وإعداد التقارير. ويؤدي ذلك إلى حدوث تأخيرات، وتكرار السجلات، وعدم اتساق التنبؤات، وضعف الرؤية لأداء الإيرادات. ومع توسع عمليات SaaS، يصبح إعداد التقارير المعتمد بشكل كبير على جداول البيانات أكثر صعوبة في الإدارة.
وغالبًا ما تقضي فرق الإدارة وقتًا أطول في مطابقة الأرقام بدلًا من تحليل اتجاهات الأداء أو تحسين التنفيذ.
|
الجانب |
مقاييس المبيعات التقليدية |
مقاييس مبيعات SaaS |
|
نموذج الإيرادات |
مبيعات لمرة واحدة أو معاملات فردية |
إيرادات متكررة قائمة على الاشتراك |
|
التركيز الأساسي |
إجمالي حجم المبيعات والإيرادات |
الاحتفاظ بالعملاء، والإيرادات المتكررة، والتوسع |
|
قياس النمو |
معدل نمو المبيعات |
معدل نمو MRR/ARR |
|
التركيز على العملاء |
يركز أساسًا على اكتساب العملاء |
اكتساب العملاء + الاحتفاظ بهم + التوسع |
|
إمكانية التنبؤ بالإيرادات |
منخفضة إلى متوسطة |
مرتفعة (متكررة وقابلة للتنبؤ) |
|
هيكل التسعير |
ثابت لكل منتج/خدمة |
اشتراك (فئات شهرية/سنوية) |
|
مقياس الكفاءة الرئيسي |
هامش الربح الإجمالي |
نسبة LTV:CAC |
|
مقياس قيمة العميل |
متوسط قيمة المعاملة (ATV) |
القيمة الدائمة للعميل (LTV) |
|
مقياس كفاءة التكلفة |
تكلفة البضاعة المباعة (COGS) |
تكلفة اكتساب العميل (CAC) |
|
تأثير الاحتفاظ بالعملاء |
أقل أهمية (عمليات الشراء المتكررة اختيارية) |
بالغ الأهمية (التسرب يؤثر مباشرة على الإيرادات) |
|
تأثير التسرب/إعادة الشراء |
معدل الشراء المتكرر (مقياس اختياري) |
معدل التسرب (مؤشر أداء رئيسي أساسي) |
|
دورة المبيعات |
قصيرة إلى متوسطة |
غالبًا ما تكون أطول، لكن الإيرادات المتكررة تتراكم مع الوقت |
|
مؤشر النجاح |
حجم مبيعات وهوامش ربح أعلى |
احتفاظ قوي بالعملاء، وتسرب منخفض، ونمو قابل للتوسع في MRR |
اقرأ أيضًا: شرح مقاييس إيرادات المبيعات التقليدية: ما الذي يجب قياسه وكيفية تتبعه
تُعد المقاييس التالية من أكثر المقاييس استخدامًا، لأنها تساعد فرق الإدارة على تقييم تكاليف اكتساب العملاء، واستقرار الإيرادات المتكررة، وجودة الاحتفاظ بالعملاء، وأداء المبيعات بشكل عام.
تقيس تكلفة اكتساب العميل (CAC) مقدار ما تنفقه الشركة لاكتساب عميل جديد.
وتشمل عادةً:
تُعد تكلفة اكتساب العميل مهمة لأنها توضح ما إذا كان اكتساب العملاء الجدد يصبح أكثر تكلفة بمرور الوقت.
يمكن أن تشير زيادة تكلفة اكتساب العميل إلى:
كما تواجه العديد من شركات SaaS صعوبة في حساب تكلفة اكتساب العميل بدقة لأن بيانات اكتساب العملاء موزعة عبر أنظمة متعددة.
مثال على معادلة CAC:
CAC = إجمالي تكاليف المبيعات والتسويق ÷ عدد العملاء الجدد الذين تم اكتسابهم
على سبيل المثال، إذا أنفقت شركة 1,875,000 ريال سعودي على المبيعات والتسويق خلال ربع سنة واكتسبت 250 عميلًا جديدًا، فإن تكلفة اكتساب العميل تبلغ 7,500 ريال سعودي لكل عميل.
تقدّر القيمة الدائمة للعميل (LTV) مقدار الإيرادات التي يحققها العميل طوال فترة علاقته مع الشركة.
وتشير القيمة الدائمة الأعلى للعميل عمومًا إلى أن العملاء يظلون نشطين لفترة أطول، أو يوسعون اشتراكاتهم، أو يحققون إيرادات متكررة ثابتة.
وبالنسبة لشركات SaaS النامية، تساعد القيمة الدائمة للعميل أيضًا فرق الإدارة على فهم ما إذا كانت جهود الاحتفاظ بالعملاء تعمل على تحسين كفاءة الإيرادات الإجمالية.
إذا ارتفعت معدلات فقدان العملاء أو انخفض تفاعل العملاء، غالبًا ما تنخفض القيمة الدائمة للعميل حتى عندما تبدو أرقام اكتساب العملاء قوية.
مثال على معادلة LTV:
LTV = متوسط الإيرادات لكل مستخدم (ARPU) ÷ معدل فقدان العملاء
وللحصول على منظور يعتمد على هامش الربح:
LTV = (ARPU × نسبة هامش الربح الإجمالي) ÷ معدل فقدان العملاء
على سبيل المثال، إذا كان متوسط الإيرادات لكل مستخدم (ARPU) يبلغ 750 ريالًا سعوديًا شهريًا، وهامش الربح الإجمالي 80%، ومعدل فقدان العملاء الشهري 2%، فإن LTV = (750 × 0.80) ÷ 0.02 = 30,000 ريال سعودي.
تقارن نسبة LTV إلى CAC بين القيمة الدائمة للعميل وتكاليف اكتساب العملاء.
ويُستخدم هذا المقياس بشكل شائع لتقييم ما إذا كان نمو العملاء مستدامًا من الناحية المالية.
تشير النسبة الصحية إلى أن:
وقد تشير النسبة الضعيفة إلى:
وبما أن هذه النسبة تجمع بين أداء اكتساب العملاء والاحتفاظ بهم، فغالبًا ما يُنظر إليها باعتبارها أحد أوضح المؤشرات على كفاءة مبيعات SaaS الإجمالية.
ومع ذلك، يعتمد الحساب الدقيق بشكل كبير على موثوقية بيانات CRM والفوترة والمالية.
المعيار المرجعي في القطاع:
LTV : CAC = 3:1 (الحد الأدنى للنمو المستدام)
تُعد نسبة 3:1 أو أعلى معيارًا مرجعيًا شائعًا في قطاع SaaS. وتشير نسبة 4:1 أو أعلى عمومًا إلى نموذج أعمال قوي، بينما قد تشير نسبة 5:1 أو أعلى إلى أن الشركة لا تستثمر بما يكفي في النمو وتترك فرصًا للمنافسين. أما نسبة 1:1 فتعني أن الشركة تخسر المال كلما زادت مبيعاتها.
تختلف المعايير المرجعية حسب القطاع: تستهدف شركات SaaS الموجهة للمستهلكين (B2C) عادةً نسبة تقارب 2.5:1، وشركات SaaS الموجهة للشركات (B2B) نحو 4:1، بينما تستهدف شركات تكنولوجيا التعليم (EdTech) حوالي 5:1. وتُعتبر النسب الأقل من 2:1 غير مستدامة بشكل عام.
كما تؤثر مرحلة الشركة في ذلك. يمكن للشركات في مراحلها المبكرة التي تقل إيراداتها السنوية المتكررة (ARR) عن 7,500,000 ريال سعودي أن تتحمل نسبًا تتراوح بين 2:1 و3:1 أثناء بناء ملاءمة المنتج للسوق، بينما ينبغي للشركات في مرحلة النمو التي تتراوح إيراداتها السنوية المتكررة بين 7,500,000 و37,500,000 ريال سعودي أن تستهدف نسبة تتراوح بين 3:1 و4:1.
تقيس الإيرادات الشهرية المتكررة (MRR) الإيرادات المتكررة والقابلة للتنبؤ التي يتم تحقيقها كل شهر من الاشتراكات النشطة.
وبالنسبة لشركات SaaS التي تعتمد على نماذج الاشتراك الشهري، غالبًا ما تكون MRR من أكثر المقاييس التي تتم مراقبتها، لأنها تعكس أداء الإيرادات على المدى القصير بصورة أكثر ديناميكية من التقارير السنوية.
كما تساعد رؤية MRR الفرق على:
وعندما تكون أنظمة إعداد التقارير مجزأة، قد تواجه الشركات صعوبة في تتبع الترقيات والإلغاءات والتجديدات أو الفوترة المتأخرة بدقة، مما قد يؤدي إلى تشويه حسابات MRR.
حساب MRR:
MRR = عدد المشتركين النشطين × متوسط الإيرادات لكل مستخدم (ARPU)
|
عنصر MRR |
العملاء |
القيمة الشهرية |
المبلغ |
|
الاشتراكات الأساسية |
200 |
SAR 562/month |
SAR 112,400 |
|
+ التوسع (الترقيات) |
20 |
+SAR 188/month |
+SAR 3,760 |
|
− الانكماش (التخفيضات) |
10 |
−SAR 112/month |
−SAR 1,120 |
|
− العملاء المتسربون |
5 |
−SAR 562/month |
−SAR 2,810 |
|
صافي MRR |
|
|
SAR 112,230 |
يُشار أحيانًا إلى هذا العرض التفصيلي لمكونات MRR باسم تحليل حركة الإيرادات الشهرية المتكررة (MRR Movement Analysis)، وهو مفيد بشكل خاص لتحديد ما إذا كانت التغيرات في الإيرادات ناتجة عن اكتساب العملاء أو الاحتفاظ بهم أو مشكلات التسعير. ويمكن الإشارة إلى ذلك في قسم لاحق إذا كان المستند يتناول تقارير الإيرادات أو تحليل معدل فقدان العملاء.
تقيس الإيرادات السنوية المتكررة (ARR) قيمة إيرادات الاشتراكات المتكررة التي يتم تحقيقها على مدار عام كامل.
وتصبح ARR أكثر فائدة مع توسع شركات SaaS، لأنها توفر رؤية أوسع وطويلة الأجل لاستقرار الإيرادات وأداء النمو.
وبالمقارنة مع MRR، تكون ARR أكثر أهمية غالبًا في:
وتساعد ARR فرق الإدارة على تقييم ما إذا كان نمو الإيرادات المتكررة يظل مستدامًا خلال دورات التشغيل الأطول.
كما تحسن الرؤية حول:
وبالنسبة للشركات التي تعمل من خلال أنظمة منفصلة لإدارة علاقات العملاء (CRM) والمالية والفوترة، قد تصبح تقارير ARR غير متسقة بسبب تأخر التجديدات أو تكرار السجلات أو تجزؤ بيانات العملاء.
حساب ARR:
ARR = MRR × 12
مثال: إذا أنهت شركة SaaS الشهر بإيرادات شهرية متكررة (MRR) تبلغ 112,230 ريالًا سعوديًا، فإن ARR تبلغ حوالي 1,346,760 ريالًا سعوديًا*.*
تقيس مدة دورة المبيعات الوقت الذي يستغرقه انتقال العميل المحتمل من التفاعل الأولي إلى إتمام الصفقة.
غالبًا ما تؤدي دورات المبيعات الطويلة إلى خفض كفاءة الإيرادات لأنها تزيد تكاليف الاكتساب وتبطئ تحقيق الإيرادات القابلة للتنبؤ. وفي العديد من شركات SaaS، تحدث التأخيرات بسبب:
يساعد تتبع مدة دورة المبيعات فرق الإدارة على تحديد مراحل تأخر الصفقات وما إذا كانت الاختناقات التشغيلية تؤثر في سرعة التحويل.
يقيس معدل تحويل العملاء المحتملين إلى عملاء مدى فعالية الشركة في تحويل العملاء المحتملين المؤهلين إلى عملاء يدفعون.
يساعد هذا المقياس على تقييم:
قد يشير انخفاض معدل التحويل إلى مشكلات مثل:
كما تصبح متابعة التحويل أكثر أهمية مع توسع شركات SaaS، لأن حجم مسار المبيعات وحده لا يضمن نمو الإيرادات.
ومن دون رؤية دقيقة لمعدلات التحويل، قد تستمر الشركات في زيادة الإنفاق على اكتساب العملاء بينما يظل نمو العملاء الفعلي غير فعال.
معادلة وحساب معدل التحويل:
معدل تحويل العملاء المحتملين إلى عملاء = (عدد العملاء الجدد ÷ إجمالي العملاء المحتملين المؤهلين) × 100
مثال: إذا حصلت شركة SaaS على 400 عميل محتمل مؤهل خلال ربع سنة، وحولت 32 منهم إلى عملاء يدفعون، فإن معدل التحويل يكون:
(32 ÷ 400) × 100 = معدل تحويل 8%
وللحصول على رؤية إضافية لمسار المبيعات، يمكن أيضًا تتبع معدل التحويل في كل مرحلة:
|
مرحلة مسار المبيعات |
العملاء المحتملون الداخلون |
العملاء المحتملون المتقدمون |
معدل التحويل بالمرحلة |
|
عميل محتمل مؤهل تسويقيًا (MQL) |
1,200 |
400 |
33% |
|
عميل محتمل مؤهل للمبيعات (SQL) |
400 |
120 |
30% |
|
العرض / التجربة التوضيحية |
120 |
60 |
50% |
|
صفقة مغلقة رابحة |
60 |
32 |
53% |
|
الإجمالي من العميل المحتمل إلى العميل الفعلي |
1,200 |
32 |
2.7% |
يساعد هذا التحليل التفصيلي مرحلةً بمرحلة فرق الإيرادات والعمليات على تحديد النقطة التي يتراجع فيها العملاء المحتملون بالضبط، بدلًا من التعامل مع معدل التحويل كرقم واحد من البداية إلى النهاية.
يقيس معدل فقدان العملاء عدد العملاء الذين يتوقفون عن استخدام المنتج أو يلغون اشتراكاتهم خلال فترة زمنية محددة.
وبالنسبة لشركات SaaS، يؤثر معدل فقدان العملاء بشكل مباشر في استقرار الإيرادات المتكررة واستدامة النمو على المدى الطويل.
قد يشير ارتفاع معدل فقدان العملاء إلى:
تلعب الرؤية التشغيلية دورًا مهمًا هنا. فعندما تعمل أنظمة نجاح العملاء والمالية والدعم بشكل منفصل، تصبح متابعة التجديدات ومراقبة الاحتفاظ بالعملاء أكثر صعوبة ودقة.
وتساعد مراقبة معدل فقدان العملاء باستمرار الشركات على تحديد مشكلات الاحتفاظ بالعملاء قبل أن تؤثر بشكل كبير في التنبؤ بالإيرادات.
معادلة ومثال على معدل فقدان العملاء:
معدل فقدان العملاء = (عدد العملاء الذين تم فقدانهم خلال الفترة ÷ عدد العملاء في بداية الفترة) × 100
مثال: إذا بدأت شركة SaaS الشهر بـ500 عميل نشط وفقدت 20 عميلًا بحلول نهاية الشهر:
(20 ÷ 500) × 100 = معدل فقدان عملاء شهري بنسبة 4%
ويمكن أيضًا تتبع معدل فقدان العملاء من حيث الإيرادات، وهو ما يقدم غالبًا صورة أكثر شمولًا:
معدل فقدان الإيرادات = (MRR المفقودة خلال الفترة ÷ MRR في بداية الفترة) × 100
|
نوع التسرب |
ما الذي يقيسه |
مثال |
|
تسرب العملاء |
عدد العملاء المفقودين |
20 من أصل 500 = 4% |
|
تسرب الإيرادات |
MRR المفقود بسبب الإلغاءات |
SAR 15,000 مفقودة من SAR 112,230 من MRR = 13.4% |
|
إجمالي تسرب الإيرادات |
إجمالي MRR المفقود قبل التوسع |
الإلغاءات + التخفيضات فقط |
|
صافي تسرب الإيرادات |
MRR المفقود بعد خصم التوسع |
إجمالي التسرب ناقص إيرادات الترقية |
يمكن أن يُظهر النشاط التجاري معدل انخفاض منخفضًا في عدد العملاء، ولكن معدل انخفاض مرتفعًا في الإيرادات إذا كانت أكبر حساباته هي التي تقوم بالإلغاء. ويمنح تتبع كلا الرقمين معًا صورة أكثر دقة عن صحة الاحتفاظ بالعملاء.
معايير معدل انخفاض العملاء:
|
مرحلة الشركة |
التسرب الشهري المقبول |
المعادل السنوي |
|
شركات SaaS في المرحلة المبكرة |
حتى 5% |
~46% |
|
شركات SaaS في مرحلة النمو |
1% – 2% |
~12% – 22% |
|
شركات SaaS المؤسسية |
أقل من 0.5% |
أقل من 6% |
تقيس سرعة المبيعات مدى سرعة تحقيق النشاط التجاري للإيرادات من خلال مسار المبيعات.
يجمع هذا المقياس بين عدة عوامل تشغيلية، منها:
عادةً ما تشير سرعة المبيعات المرتفعة إلى أن الصفقات تتحرك بكفاءة عبر مسار المبيعات وتتحول إلى إيرادات بشكل منتظم.
وقد تكشف سرعة المبيعات المنخفضة عن:
وبما أن سرعة المبيعات تجمع عدة مقاييس لمسار المبيعات في مؤشر تشغيلي واحد، فإنها تساعد فرق الإدارة على تقييم كفاءة تحقيق الإيرادات بشكل أكثر وضوحًا.
معادلة سرعة المبيعات وحسابها:
سرعة المبيعات = (عدد الفرص × متوسط قيمة الصفقة × معدل التحويل) ÷ متوسط طول دورة المبيعات بالأيام
تنتج هذه المعادلة معدلًا يوميًا لتوليد الإيرادات، يوضح متوسط مقدار الإيرادات التي يحققها مسار المبيعات يوميًا.
|
المتغير المدخل |
القيمة |
|
عدد الفرص النشطة |
120 |
|
متوسط قيمة الصفقة |
SAR 18,750 |
|
معدل التحويل |
30% |
|
متوسط طول دورة المبيعات |
45 يومًا |
سرعة المبيعات = (120 × 18,750 ريال سعودي × 0.30) ÷ 45
= 675,000 ريال سعودي ÷ 45
= 15,000 ريال سعودي يوميًا
هذا يعني أن مسار المبيعات يحقق إيرادات تُقدّر بحوالي 15,000 ريال سعودي يوميًا في ظل الظروف الحالية. وأي تحسن في حجم الصفقات أو معدل التحويل أو طول دورة المبيعات سيؤدي مباشرةً إلى زيادة هذا الرقم.
يساعد هذا التحليل الحساس للمتغيرات فرق الإيرادات والعمليات على تحديد العامل الذي يجب تحسينه أولًا، بناءً على فرص تحقيق أكبر مكاسب في الكفاءة ضمن مسار المبيعات الحالي.
تساعد مقاييس كفاءة المبيعات فرق الإدارة على فهم كيفية تحقيق أداء الإيرادات وتتبع هذا الأداء والحفاظ عليه فعليًا.
تساعد مقاييس كفاءة المبيعات الفرق على تحديد المواضع التي تتباطأ فيها الفرص داخل مسار المبيعات.
على سبيل المثال، قد يحقق نشاط تجاري حجمًا كبيرًا من العملاء المحتملين، لكنه يواجه معدلات تحويل منخفضة خلال مراحل تقديم العروض أو التفاوض. وتساعد مقاييس مثل سرعة المبيعات، ومعدل تحويل العملاء المحتملين إلى عملاء، والتقدم عبر مراحل مسار المبيعات قادة الإيرادات على تحديد هذه الاختناقات في وقت مبكر.
كما تحسّن هذه الرؤية دقة التنبؤات من خلال توضيح ما إذا كان نمو مسار المبيعات يتحول إلى إيرادات متكررة يمكن التنبؤ بها.
يساعد تتبع مقاييس كفاءة المبيعات على تحسين التخطيط التشغيلي مع توسع الأعمال.
وتساعد مقاييس مثل تكلفة اكتساب العميل (CAC)، والإيرادات الشهرية المتكررة (MRR)، ومعدل انخفاض العملاء على اتخاذ قرارات أكثر دقة بشأن:
ومن دون تقارير موثوقة، غالبًا ما يصبح التخطيط للنمو قائمًا على ردود الفعل بدلًا من أن يكون قائمًا على البيانات.
غالبًا ما تعمل فرق المبيعات والمالية باستخدام أنظمة وهياكل تقارير مختلفة. وعندما تتم مزامنة بيانات العملاء وسجلات الفواتير والتجديدات والتنبؤات بشكل صحيح، يتحسن اتساق التقارير وتقل الحاجة إلى المطابقة اليدوية بين الأقسام.
تتبع العديد من شركات SaaS مقاييس كفاءة المبيعات بانتظام، لكنها لا تزال تواجه صعوبة في الوثوق بالأرقام التي تراها. وفي معظم الحالات، لا تكمن المشكلة في المقياس نفسه، بل في عملية إعداد التقارير التي تقف وراءه.
عندما تعمل منصات CRM والمالية بشكل منفصل، يصبح من الصعب تجنب التناقضات في التقارير.
قد لا تتطابق سجلات العملاء بين الأنظمة، وقد تتأخر تحديثات الفواتير، وقد تصبح بيانات التجديدات مجزأة. وهذا يؤدي غالبًا إلى:
ومن دون مزامنة البيانات التشغيلية، تصبح مقاييس مثل CAC وMRR وARR أكثر صعوبة في التحقق منها بشكل موثوق.
لا تزال العديد من شركات SaaS المتنامية تعتمد بشكل كبير على جداول البيانات لإعداد تقارير الإيرادات. ورغم أن جداول البيانات قد تكون مناسبة خلال المراحل الأولى من النمو، فإنها غالبًا ما تخلق تحديات تشغيلية مع زيادة تعقيد التقارير. وتشمل المشكلات الشائعة:
وقد تقضي فرق الإدارة وقتًا أطول في مطابقة الأرقام بدلًا من تحليل اتجاهات الأداء.
يؤثر تأخر إصدار الفواتير أو بطء تحديث الإيرادات بشكل مباشر على التنبؤات وقياس الكفاءة. وإذا لم يتم تحديث تجديدات الاشتراكات أو ترقياتها أو إلغاؤها بسرعة، فقد لا تعكس مقاييس الإيرادات المتكررة أداء النشاط التجاري الفعلي.
اقرأ أيضًا: التحديات في قطاع التجزئة وحلولها
تحتاج الشركات إلى اتساق تشغيلي أقوى، وسير عمل أكثر تنظيمًا لإعداد التقارير، وتنسيق أفضل بين الأقسام. ومع زيادة حجم المبيعات وبيانات العملاء، يعتمد إعداد التقارير الموثوقة بشكل كبير على كيفية انتقال المعلومات داخل المؤسسة.
تساعد إجراءات العمل المتسقة على تحسين دقة التقارير عبر دورة المبيعات.
عندما تتبع الفرق عمليات موحدة لتأهيل العملاء المحتملين، وتتبع الفرص، وإصدار الفواتير، وتحديث بيانات العملاء، تقل التناقضات في التقارير والسجلات المكررة.
كما تسهّل إدارة البيانات بشكل مركزي الحفاظ على دقة حسابات مؤشرات مثل:
ومن دون إجراءات موحدة، غالبًا ما تنخفض جودة التقارير مع توسع العمليات.
تصبح مقاييس كفاءة المبيعات أكثر موثوقية عندما تعمل الأقسام اعتمادًا على بيانات تشغيلية مترابطة.
على سبيل المثال، تساعد عمليات العمل المتزامنة بين فرق CRM والمالية والفوترة ونجاح العملاء على تحسين:
كما تساعد الرؤية الأفضل فرق الإدارة على تحديد مشكلات الأداء في وقت مبكر بدلًا من الاعتماد على التقارير الشهرية المتأخرة.
توفر لوحات المعلومات المركزية للفرق إمكانية الوصول الفوري إلى المقاييس التشغيلية من أنظمة متعددة.
وهذا يحسن الرؤية في:
وتقلل التقارير في الوقت الفعلي من الاعتماد على دمج جداول البيانات يدويًا، وتحسن سرعة اتخاذ القرارات.
توفر مقاييس كفاءة المبيعات قيمة أكبر عند مراجعتها باستمرار مع مرور الوقت. وتساعد مراجعات التقارير المنتظمة الشركات على تحديد التغيرات التشغيلية، واتجاهات التحويل، ومخاطر التنبؤ في وقت مبكر، قبل أن تؤثر بشكل كبير على أداء الإيرادات.
مع توسع شركات SaaS، غالبًا ما تجعل التقارير المجزأة بين المبيعات والمالية والفوترة والعمليات مقاييس الإيرادات أكثر صعوبة في التحقق منها وإدارتها بشكل متسق.
تساعد منصات مثل HAL ERP الشركات على توحيد التقارير وسير العمل والفوترة والرؤية التشغيلية من خلال لوحات معلومات مترابطة وعمليات أعمال متزامنة. ويساعد ذلك الفرق على تحسين دقة التنبؤات، وتتبع الإيرادات المتكررة بشكل أكثر موثوقية، وتقليل المطابقة اليدوية بين الأقسام.
كما يمكن للشركات المتنامية استخدام هياكل التقارير المركزية للحصول على رؤية أفضل لأداء مسار المبيعات، وتجديدات العملاء، وحالة الفواتير، والاختناقات التشغيلية قبل أن تؤثر على نمو الإيرادات.
استكشف قصص نجاح عملاء HAL ERP ودراسات الحالة لمعرفة كيف حسّنت الشركات الرؤية التشغيلية وكفاءة إعداد التقارير:
هل تحتاج إلى تحسين الرؤية التشغيلية وسير عمل إعداد تقارير SaaS؟ احجز استشارة مع فريق HAL ERP لاستكشاف كيفية دعم التقارير المركزية للنمو القابل للتوسع.
مقاييس كفاءة المبيعات في شركات SaaS هي مؤشرات أداء رئيسية تُستخدم لقياس مدى فعالية شركة SaaS في اكتساب العملاء وتحويلهم والاحتفاظ بهم وتنمية قاعدة عملائها. وتشمل المقاييس الشائعة CAC وLTV وMRR وARR ومعدل انخفاض العملاء ومعدل التحويل وسرعة المبيعات.
تساعد هذه المقاييس الشركات على تقييم إمكانية التنبؤ بالإيرادات، والاحتفاظ بالعملاء، وكفاءة اكتساب العملاء، والأداء التشغيلي. كما تدعم تحسين التنبؤات والميزانيات والتوظيف والتخطيط للنمو على المدى الطويل.
تُعتبر نسبة LTV الصحية لشركات SaaS عمومًا حوالي 3:1. وهذا يعني أن الإيرادات التي يحققها العميل تكون أعلى بثلاث مرات من تكلفة اكتسابه.
يمكن للشركات تحسين مقاييس كفاءة المبيعات من خلال توحيد إجراءات العمل، وتحسين الرؤية بين الأقسام، وتوحيد التقارير مركزيًا، وتقليل عمليات جداول البيانات اليدوية، واستخدام أنظمة ERP أو CRM مترابطة للحصول على بيانات تشغيلية أكثر دقة.
تساعد التقارير المركزية الشركات على دمج بيانات المبيعات والمالية والفوترة والعمليات في نظام واحد. وهذا يحسن دقة التقارير، واتساق التنبؤات، والرؤية الفورية لأداء الإيرادات المتكررة. وتدعم منصات مثل HAL ERP لوحات المعلومات المركزية ووضوح سير العمل للشركات المتنامية.