

As Saudi SaaS companies grow, tracking recurring revenue becomes harder when sales, finance, billing, and reporting systems operate separately. Teams often struggle with delayed forecasting, inconsistent churn reporting, rising acquisition costs, and spreadsheet-heavy workflows that reduce visibility across departments.
According to PwC’s 29th Global CEO Survey, 71% of Saudi business leaders expect revenue growth over the next three years, increasing the need for stronger forecasting, operational visibility, and scalable reporting processes.
SaaS sales efficiency metrics help businesses measure whether growth is sustainable, profitable, and operationally manageable. Metrics such as Customer Acquisition Cost (CAC), Customer Lifetime Value (LTV), Monthly Recurring Revenue (MRR), churn rate, and sales velocity provide clearer insight into acquisition efficiency, retention performance, and revenue predictability.
For growing Saudi businesses, understanding these metrics is becoming increasingly important for improving reporting accuracy, reducing operational blind spots, and supporting better financial decision-making.
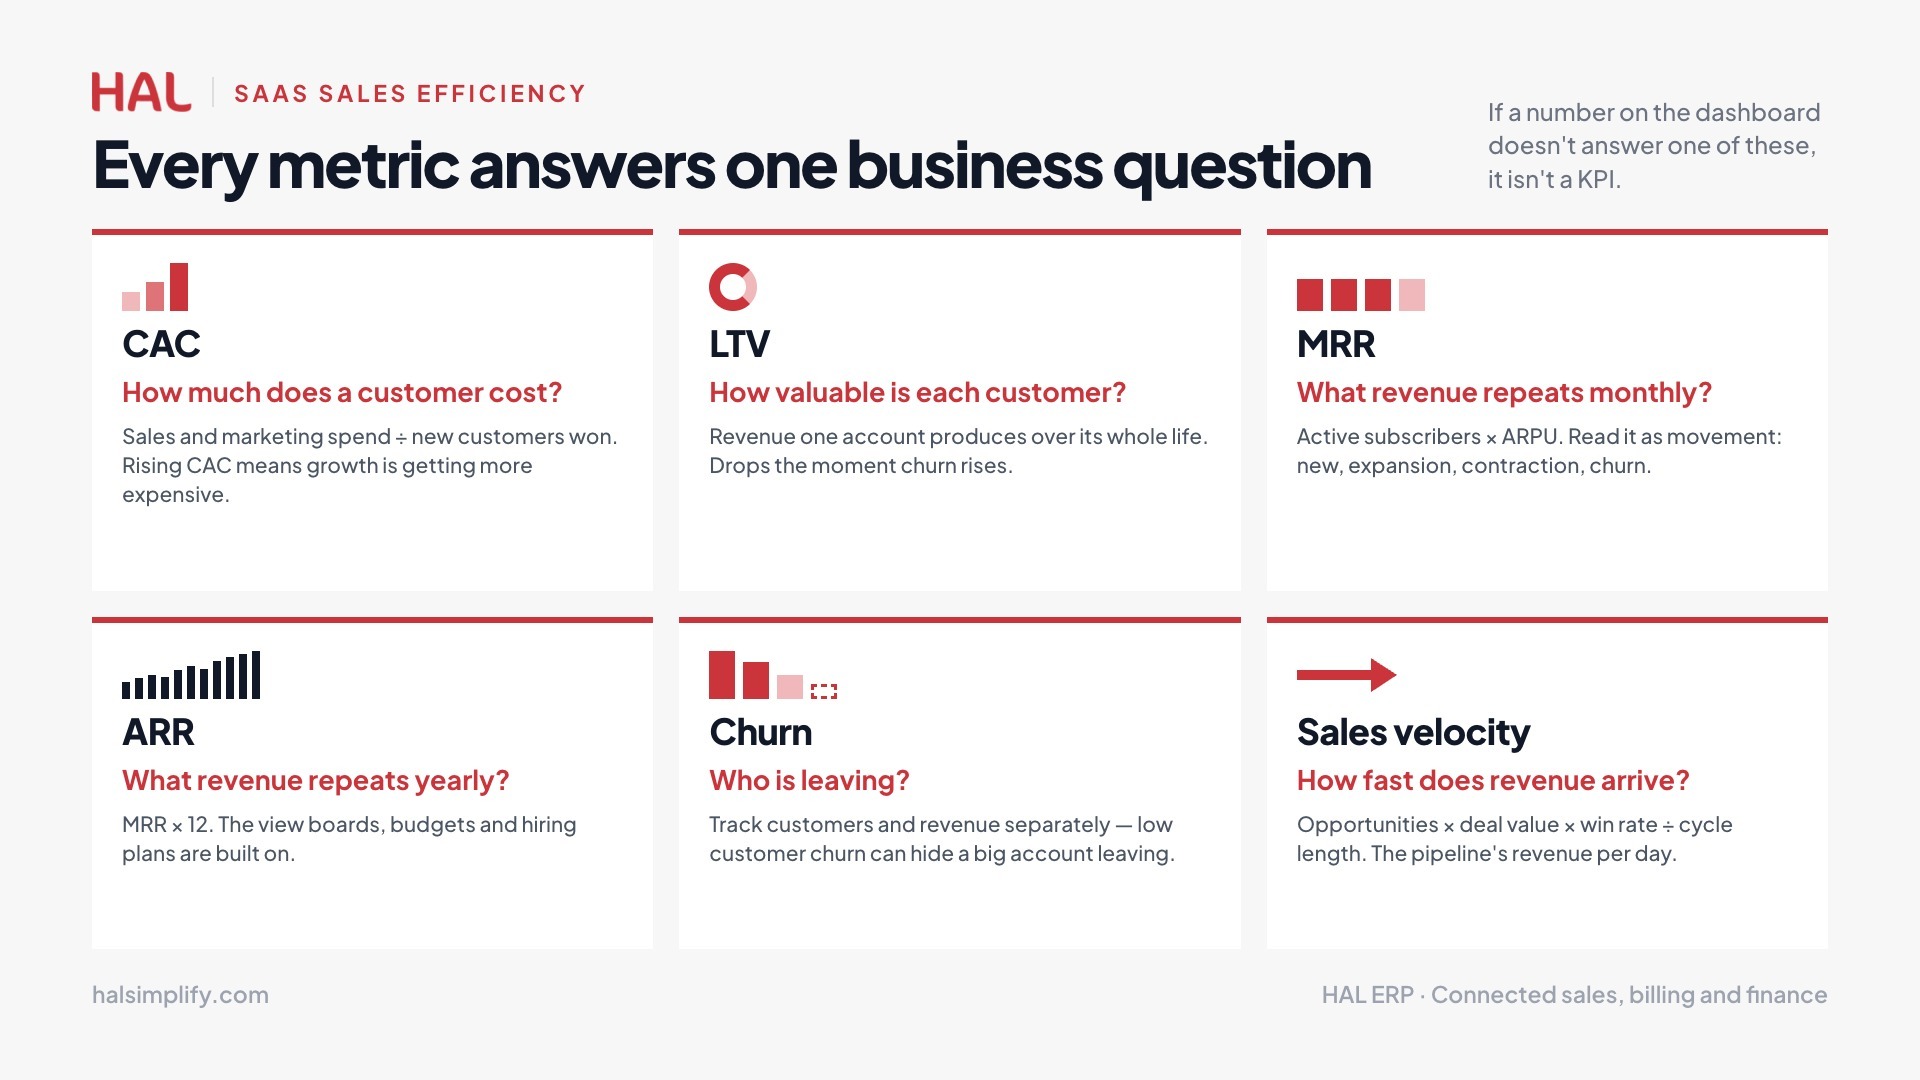
SaaS sales efficiency metrics measure how effectively sales and revenue operations generate recurring revenue, covering customer acquisition, conversion, retention, and overall sales productivity. For growing SaaS companies, these numbers directly shape forecasting, budgeting, hiring, and operational planning, not just reporting.
They pull data from CRMs, billing platforms, finance tools, and sales dashboards, and include indicators like:
Together, these reveal whether sales performance is scaling sustainably or becoming harder to grow.
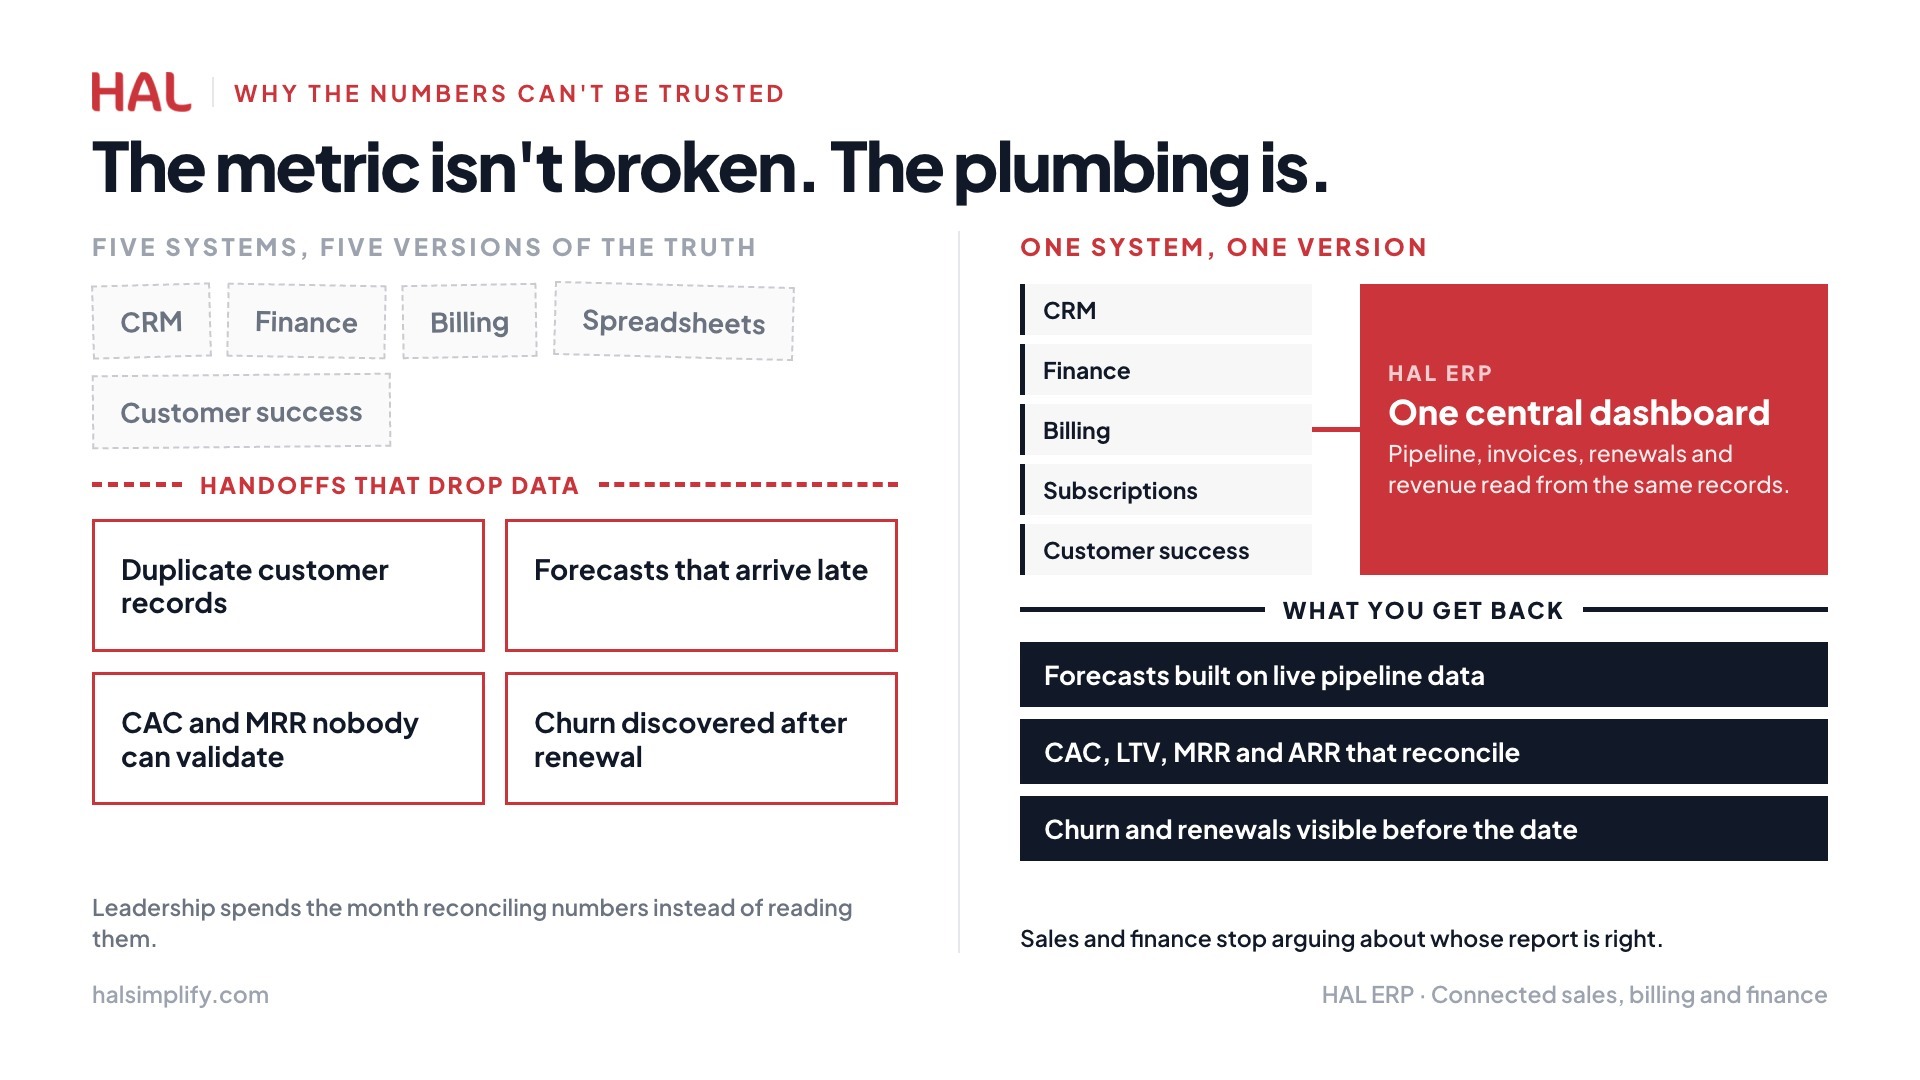
Many SaaS businesses rely on disconnected systems across sales, finance, billing, and reporting. This creates delays, duplicate records, inconsistent forecasting, and limited visibility into revenue performance. As SaaS operations grow, spreadsheet-heavy reporting becomes harder to manage.
Leadership teams often spend more time reconciling numbers than analyzing performance trends or improving execution.

Also read: Traditional Sales Revenue Metrics Explained: What to Measure and How to Track
The metrics below are among the most widely used because they help leadership teams evaluate acquisition costs, recurring revenue stability, retention quality, and overall sales performance.
Customer Acquisition Cost (CAC) measures how much a business spends to acquire a new customer.
It typically includes:
CAC matters because it shows whether customer growth is becoming more expensive over time.
A rising CAC can indicate:
Many SaaS companies also struggle with inaccurate CAC calculations because customer acquisition data is spread across multiple systems.
CAC Formula Example:
CAC = Total Sales & Marketing Costs ÷ Number of New Customers Acquired
For example, if a company spends SAR 1,875,000 on sales and marketing in a quarter and acquires 250 new customers, the CAC is SAR 7,500 per customer.
Customer Lifetime Value (LTV) estimates how much revenue a customer generates throughout the business relationship.
A higher LTV generally indicates that customers remain active longer, expand their subscriptions, or generate consistent recurring revenue.
For growing SaaS businesses, LTV also helps leadership teams understand whether customer retention efforts are improving overall revenue efficiency.
If churn rates increase or customer engagement weakens, LTV often declines even when acquisition numbers appear strong.
LTV Formula Example:
LTV = ARPU ÷ Churn Rate
For a margin-adjusted view:
LTV = (ARPU × Gross Margin %) ÷ Churn Rate
For example, if ARPU is SAR 750/month, gross margin is 80%, and monthly churn is 2%, then LTV = (SAR 750 × 0.80) ÷ 0.02 = SAR 30,000.
The LTV to CAC ratio compares customer lifetime value against acquisition costs.
This metric is commonly used to assess whether customer growth is financially sustainable.
A healthy ratio suggests that:
A weak ratio may indicate:
Because this ratio combines both acquisition and retention performance, it is often viewed as one of the clearest indicators of overall SaaS sales efficiency.
However, accurate calculation depends heavily on reliable CRM, billing, and finance data.
Industry Benchmark:
LTV : CAC = 3:1 (minimum threshold for sustainable growth)
A ratio of 3:1 or better is the widely accepted SaaS benchmark. A ratio of 4:1 or higher generally indicates a strong business model, while a ratio of 5:1 or above may suggest the company is under-investing in growth and ceding ground to competitors. A ratio of 1:1 means the business loses money the more it sells.
Benchmarks vary by segment: B2C SaaS companies typically target around 2.5:1, B2B SaaS companies around 4:1, and EdTech companies around 5:1. Ratios below 2:1 are generally considered unsustainable.
The company stage also matters. Early-stage companies under SAR 7,500,000 ARR can tolerate ratios between 2:1 and 3:1 while building product-market fit, whereas growth-stage companies between SAR 7,500,000 and SAR 37,500,000 ARR should be targeting 3:1 to 4:1.
Monthly Recurring Revenue (MRR) measures predictable recurring revenue generated each month from active subscriptions.
For SaaS companies with monthly subscription models, MRR is often one of the most closely monitored metrics because it reflects short-term revenue performance more dynamically than annual reporting.
MRR visibility also helps teams:
When reporting systems are fragmented, businesses may struggle to track upgrades, cancellations, renewals, or delayed billing accurately, which can distort MRR calculations.
MRR Calculation:
MRR = Number of Active Subscribers × Average Revenue Per User (ARPU)
This component view of MRR is sometimes referred to as MRR Movement Analysis and is particularly useful for identifying whether revenue changes are driven by acquisition, retention, or pricing issues. You may want to reference this in a later section if your document covers revenue reporting or churn analysis.
Annual Recurring Revenue (ARR) measures the value of recurring subscription revenue generated over a full year.
ARR becomes more useful as SaaS businesses scale because it provides a broader long-term view of revenue stability and growth performance.
Compared to MRR, ARR is often more relevant for:
ARR helps leadership teams evaluate whether recurring revenue growth remains sustainable over longer operational cycles.
It also improves visibility into:
For businesses operating with disconnected CRM, finance, and invoicing systems, ARR reporting can become inconsistent due to delayed renewals, duplicate records, or fragmented customer data.
ARR Calculation:
ARR = MRR × 12
Example: If a SaaS business closes the month with an MRR of SAR 112,230, its ARR is approximately SAR 1,346,760.
Sales cycle length measures how long it takes for a lead to move from initial engagement to a closed deal.
Long sales cycles often reduce revenue efficiency because they increase acquisition costs and slow predictable revenue generation. In many SaaS companies, delays happen due to:
Tracking sales cycle length helps leadership teams identify where deals are getting delayed and whether operational bottlenecks are affecting conversion speed.
Lead-to-customer conversion rate measures how effectively a business converts qualified leads into paying customers.
This metric helps evaluate:
A low conversion rate may indicate problems such as:
Conversion tracking also becomes more valuable as SaaS businesses scale because pipeline volume alone does not guarantee revenue growth.
Without accurate conversion visibility, businesses may continue increasing acquisition spend while actual customer growth remains inefficient.
Conversion Rate Formula and Calculation:
Lead-to-Customer Conversion Rate = (Number of New Customers ÷ Total Qualified Leads) × 100
Example: If a SaaS business generates 400 qualified leads in a quarter and closes 32 as paying customers, the conversion rate is:
(32 ÷ 400) × 100 = 8% conversion rate
For additional pipeline visibility, conversion can also be tracked at each stage:
This stage-by-stage breakdown helps revenue and operations teams pinpoint exactly where leads are dropping off, rather than treating conversion as a single end-to-end figure.
Churn rate measures how many customers stop using a product or cancel subscriptions during a specific period.
For SaaS businesses, churn directly impacts recurring revenue stability and long-term growth sustainability.
A rising churn rate may signal:
Operational visibility plays an important role here. If customer success, finance, and support systems operate separately, renewal tracking and retention monitoring become harder to manage accurately.
Monitoring churn consistently helps businesses identify retention problems before they significantly affect revenue forecasting.
Churn Rate Formula and Example:
Customer Churn Rate = (Customers Lost During Period ÷ Customers at Start of Period) × 100
Example: If a SaaS business starts the month with 500 active customers and loses 20 by month end:
(20 ÷ 500) × 100 = 4% monthly churn rate
Churn can also be tracked in revenue terms, which often tells a more complete story:
Revenue Churn Rate = (MRR Lost During Period ÷ MRR at Start of Period) × 100
A business can show low customer churn but high revenue churn if its largest accounts are the ones cancelling. Tracking both figures together gives a more accurate view of retention health.
Churn Rate Benchmarks:
Sales velocity measures how quickly a business generates revenue through its sales pipeline.
This metric combines several operational factors, including:
A strong sales velocity usually indicates that deals are moving efficiently through the pipeline and converting into revenue consistently.
Lower sales velocity may reveal:
Because sales velocity combines multiple pipeline metrics into a single operational view, it helps leadership teams assess overall revenue generation efficiency more clearly.
Sales Velocity Formula and Calculation:
Sales Velocity = (Number of Opportunities × Average Deal Value × Conversion Rate) ÷ Average Sales Cycle Length (Days)
This formula produces a daily revenue generation rate, showing how much revenue the pipeline is producing on average each day.
Sales Velocity = (120 × SAR 18,750 × 0.30) ÷ 45
= SAR 675,000 ÷ 45
= SAR 15,000 per day
This means the pipeline is generating approximately SAR 15,000 in revenue every day under current conditions. Any improvement to deal size, conversion rate, or cycle length will directly increase this figure.
This sensitivity breakdown helps revenue and operations teams prioritise which lever to optimise first based on where the biggest efficiency gains are available in the current pipeline.
Sales efficiency metrics help leadership teams understand how revenue performance is actually being generated, tracked, and sustained.
Sales efficiency metrics help teams identify where opportunities are slowing down inside the pipeline.
For example, a business may generate strong lead volume but struggle with low conversion rates during proposal or negotiation stages. Metrics such as sales velocity, lead-to-customer conversion rate, and pipeline stage progression help revenue leaders pinpoint these bottlenecks earlier.
This visibility also improves forecasting accuracy by showing whether pipeline growth is translating into predictable recurring revenue.
Tracking sales efficiency metrics supports better operational planning as businesses scale.
Metrics like Customer Acquisition Cost (CAC), Monthly Recurring Revenue (MRR), and churn rate help leadership teams make more informed decisions around:
Without reliable reporting, growth planning often becomes reactive instead of data-driven.
Sales and finance teams often work from different systems and reporting structures. When customer data, invoicing records, renewals, and forecasting are synchronized properly. This improves reporting consistency and reduces manual reconciliation between departments.
Many SaaS businesses track sales efficiency metrics regularly but still struggle to trust the numbers they see. In most cases, the problem is not the metric itself. It is the reporting process behind it.
When CRM and finance platforms operate separately, reporting inconsistencies become difficult to avoid.
Customer records may not match across systems, invoice updates may be delayed, and renewal data can become fragmented. This often creates:
Without synchronized operational data, metrics such as CAC, MRR, and ARR become harder to validate reliably.
Many growing SaaS companies still depend heavily on spreadsheets for revenue reporting. While spreadsheets may work during early growth stages, they often create operational challenges as reporting complexity increases. Common issues include:
Leadership teams may spend more time reconciling numbers than analyzing performance trends.
Delayed invoicing or slow revenue recognition affects forecasting and efficiency measurement directly. If subscription renewals, upgrades, or cancellations are not updated quickly, recurring revenue metrics may no longer reflect actual business performance.
Also read: Challenges In Retailing And Solutions
Businesses need stronger operational consistency, cleaner reporting workflows, and better coordination between departments. As sales volume and customer data increase, reliable reporting depends heavily on how information moves across the organization.
Consistent workflows improve reporting accuracy across the sales cycle.
When teams follow standardized processes for lead qualification, opportunity tracking, invoicing, and customer updates, businesses reduce reporting inconsistencies and duplicated records.
Centralized data handling also makes it easier to maintain accurate calculations for metrics such as:
Without standardized processes, reporting quality often declines as operations scale.
Sales efficiency metrics become more reliable when departments work from connected operational data.
For example, synchronized workflows between CRM, finance, billing, and customer success teams improve:
Better visibility also helps leadership teams identify performance issues earlier instead of relying on delayed monthly reporting.
Centralized dashboards give teams real-time access to operational metrics from multiple systems.
This improves visibility into:
Real-time reporting reduces dependency on manual spreadsheet consolidation and improves decision-making speed.
Sales efficiency metrics provide more value when reviewed consistently over time. Regular reporting reviews help businesses identify operational changes, conversion trends, and forecasting risks earlier, before they affect revenue performance significantly.
As SaaS businesses scale, fragmented reporting across sales, finance, billing, and operations often makes revenue metrics harder to trust and manage consistently.
Platforms such as HAL ERP help businesses centralize reporting, workflows, invoicing, and operational visibility through connected dashboards and synchronized business processes. This helps teams improve forecasting accuracy, track recurring revenue more reliably, and reduce manual reconciliation across departments.
Growing businesses can also use centralized reporting structures to gain better visibility into pipeline performance, customer renewals, invoicing status, and operational bottlenecks before they affect revenue growth.
Explore HAL ERP customer success stories and case studies to see how businesses improved operational visibility and reporting efficiency:
Need help improving operational visibility and SaaS reporting workflows? Book a consultation with the HAL ERP team to explore how centralized reporting can support scalable growth.
SaaS sales efficiency metrics are KPIs used to measure how effectively a SaaS business acquires, converts, retains, and grows customers. Common metrics include CAC, LTV, MRR, ARR, churn rate, conversion rate, and sales velocity.
These metrics help businesses evaluate revenue predictability, customer retention, acquisition efficiency, and operational performance. They also support better forecasting, budgeting, hiring, and long-term growth planning.
A healthy SaaS LTV ratio is generally considered to be around 3:1. This means the revenue generated from a customer is three times higher than the cost of acquiring them.
Businesses can improve sales efficiency metrics by standardizing workflows, improving cross-department visibility, centralizing reporting, reducing manual spreadsheet processes, and using connected ERP or CRM systems for more accurate operational data.
Centralized reporting helps businesses consolidate sales, finance, invoicing, and operational data into a single system. This improves reporting accuracy, forecasting consistency, and real-time visibility into recurring revenue performance. Platforms like HAL ERP support centralized dashboards and workflow visibility for growing businesses.