
In short: Exam analysis turns a sheet of marks into answers: which subjects, classes and compartments are doing well, which students are falling behind, and what each person in the school should do next. Four views cover it. Subject-wise (average, spread, pass rate), class-wise (the same, by class and section), compartment-wise (primary, middle and secondary) and a late bloomers list (students below 50% who need attention). Every level reads the one that fits its job, from the principal to the subject teacher. Below: why a school should do it, what each view shows, who acts on what, a sample dashboard and a free kit (PDF guide and Excel workbook).
A parent writes to the principal: "My child's Mathematics has dropped, and I hear the whole class is weak in it." The principal knows Mathematics in that class was a worry last term. Does anyone have the numbers? The class average, how it compares with English and Science in the same class, how the other sections did, whether it is one bad test or a pattern? Without them the reply is an opinion against an opinion. With them, it is a short, calm answer with a plan.
That is the case for exam analysis. Schools collect marks after every test. Fewer schools turn them into a few pages that every level of the school can act on. This article shows how, using a made-up sample school. The free exam analysis kit at the end gives you the workbook and the guide.
Marks sit in a register and a report card. On their own they say how one child did. They do not say what the school should change. Analysis does, in six ways.
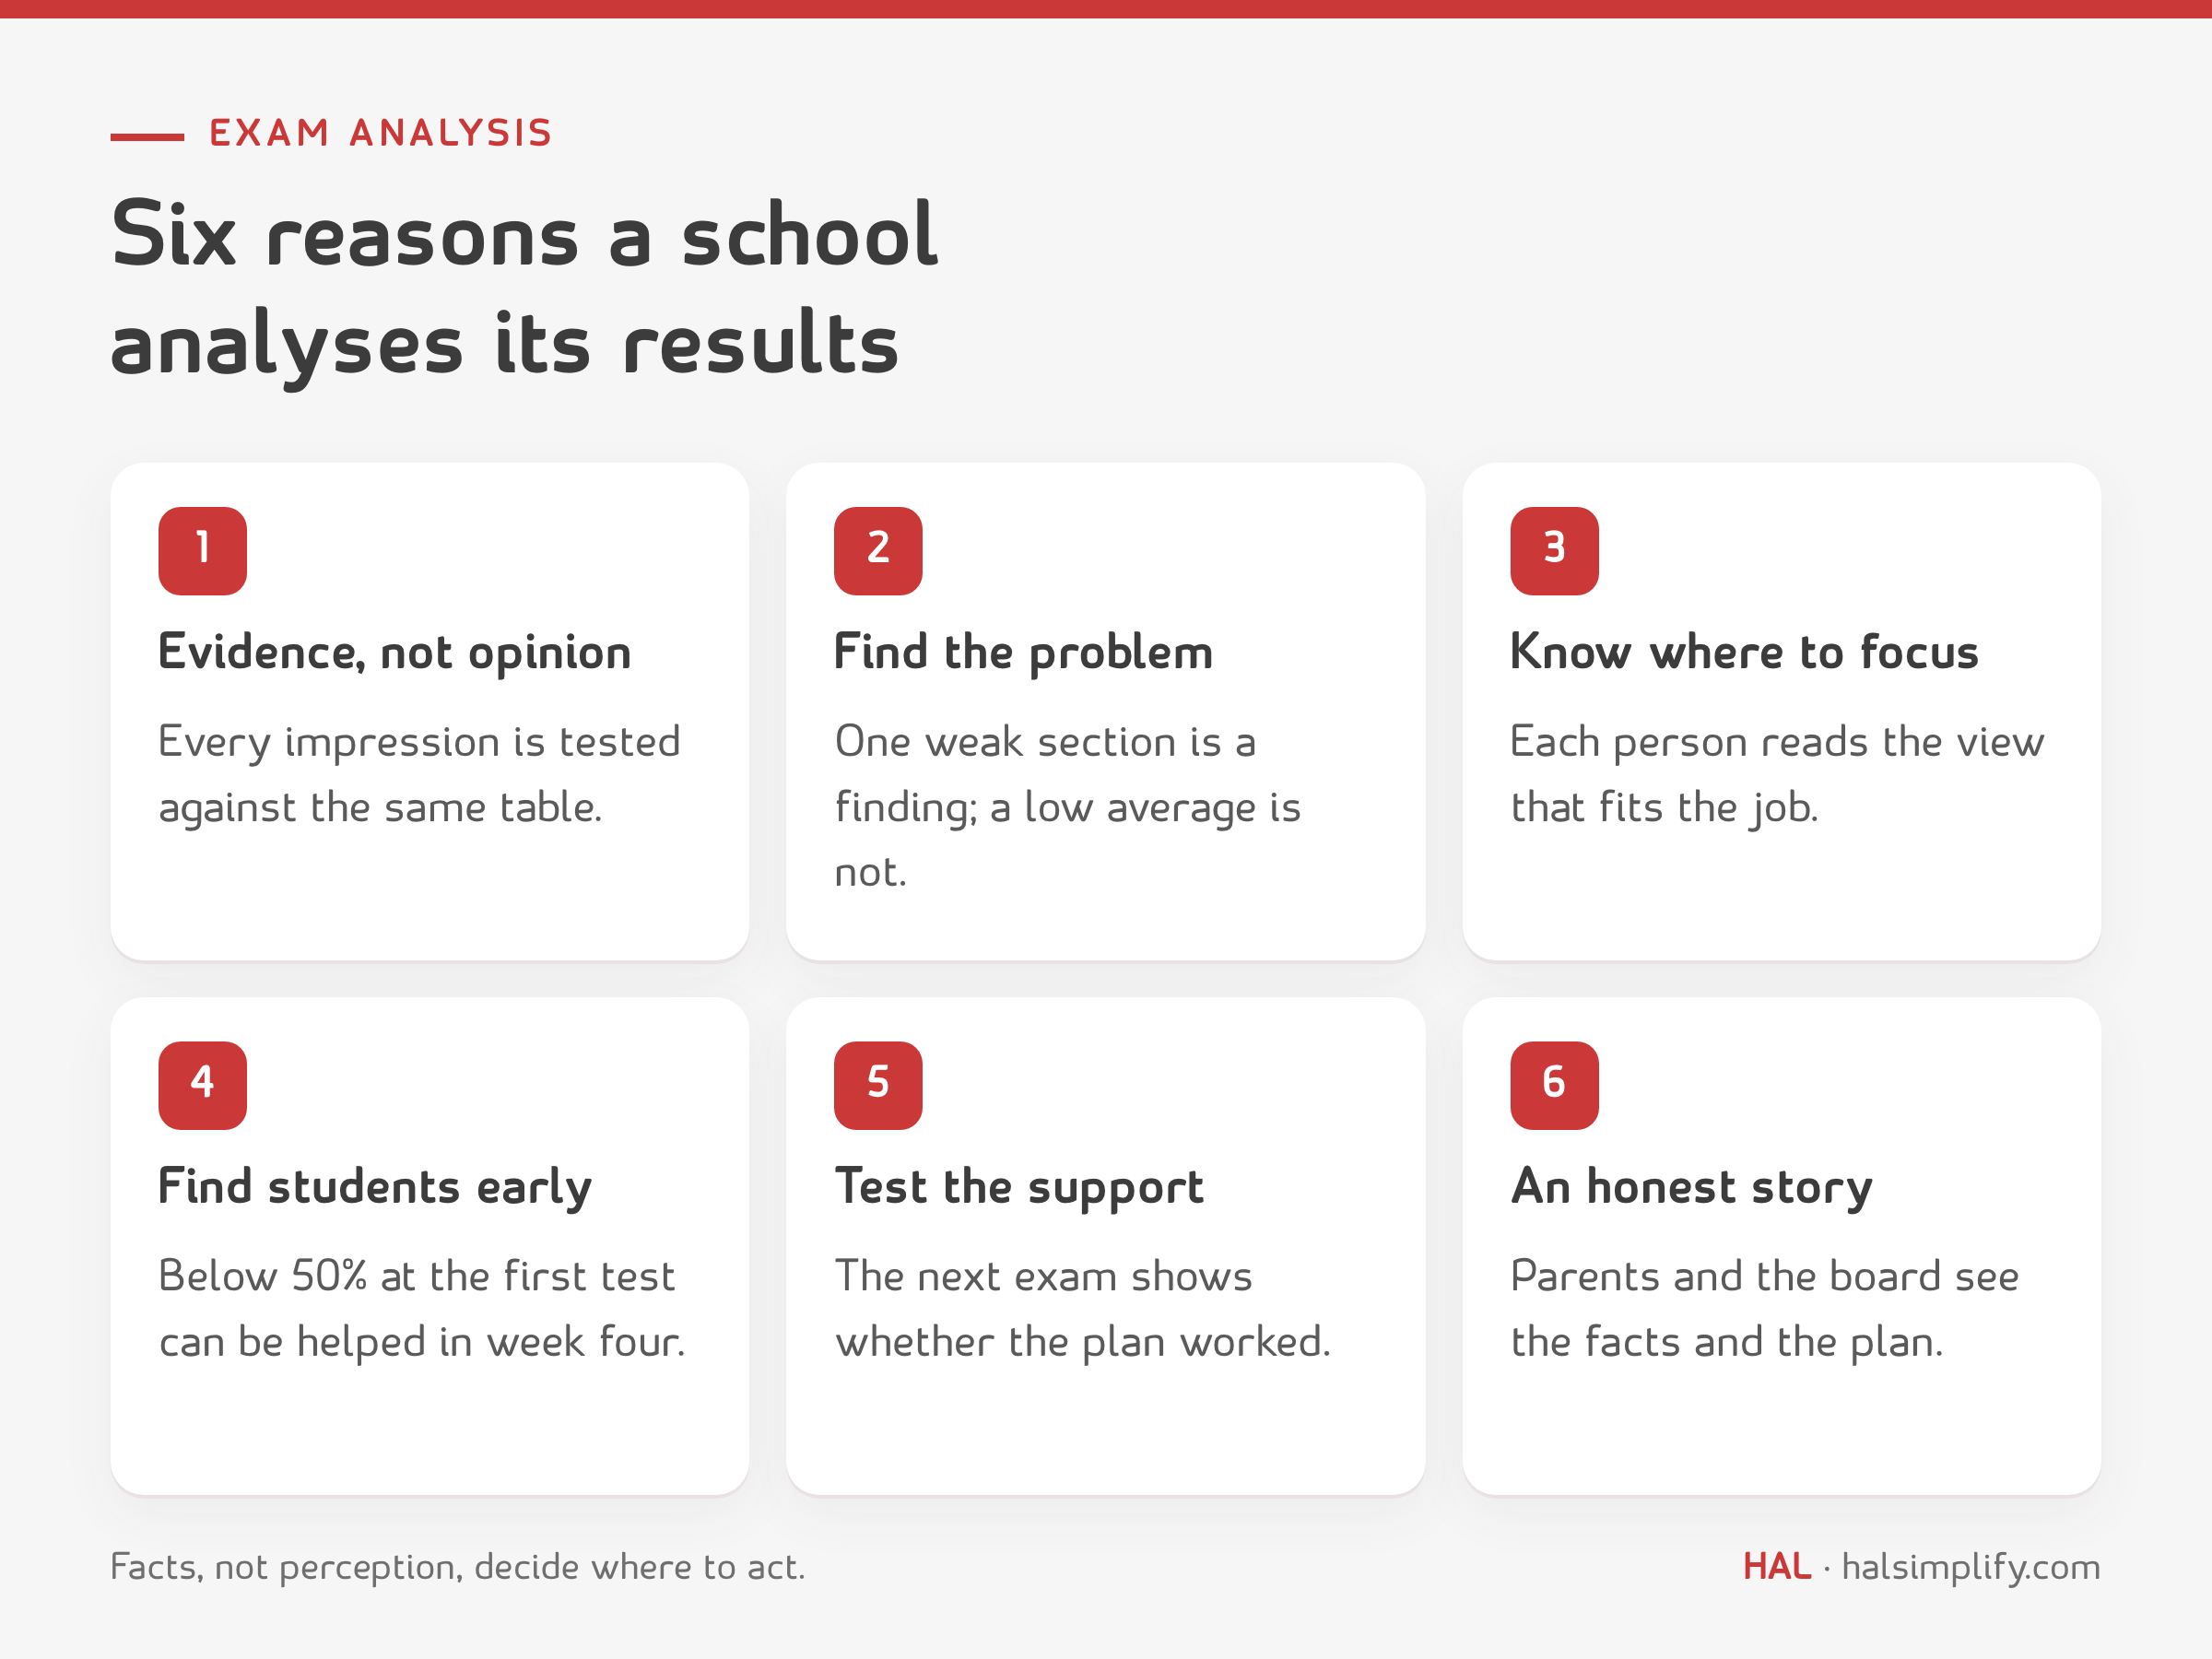
Used this way, analysis is a tool for quality. It does not rank teachers from one test and it does not label children. It shows where attention will help most.
Every view starts from the same marks, entered once by the subject teacher. Marks are converted to a common scale of 100 so that a test out of 50 and one out of 80 can sit side by side.
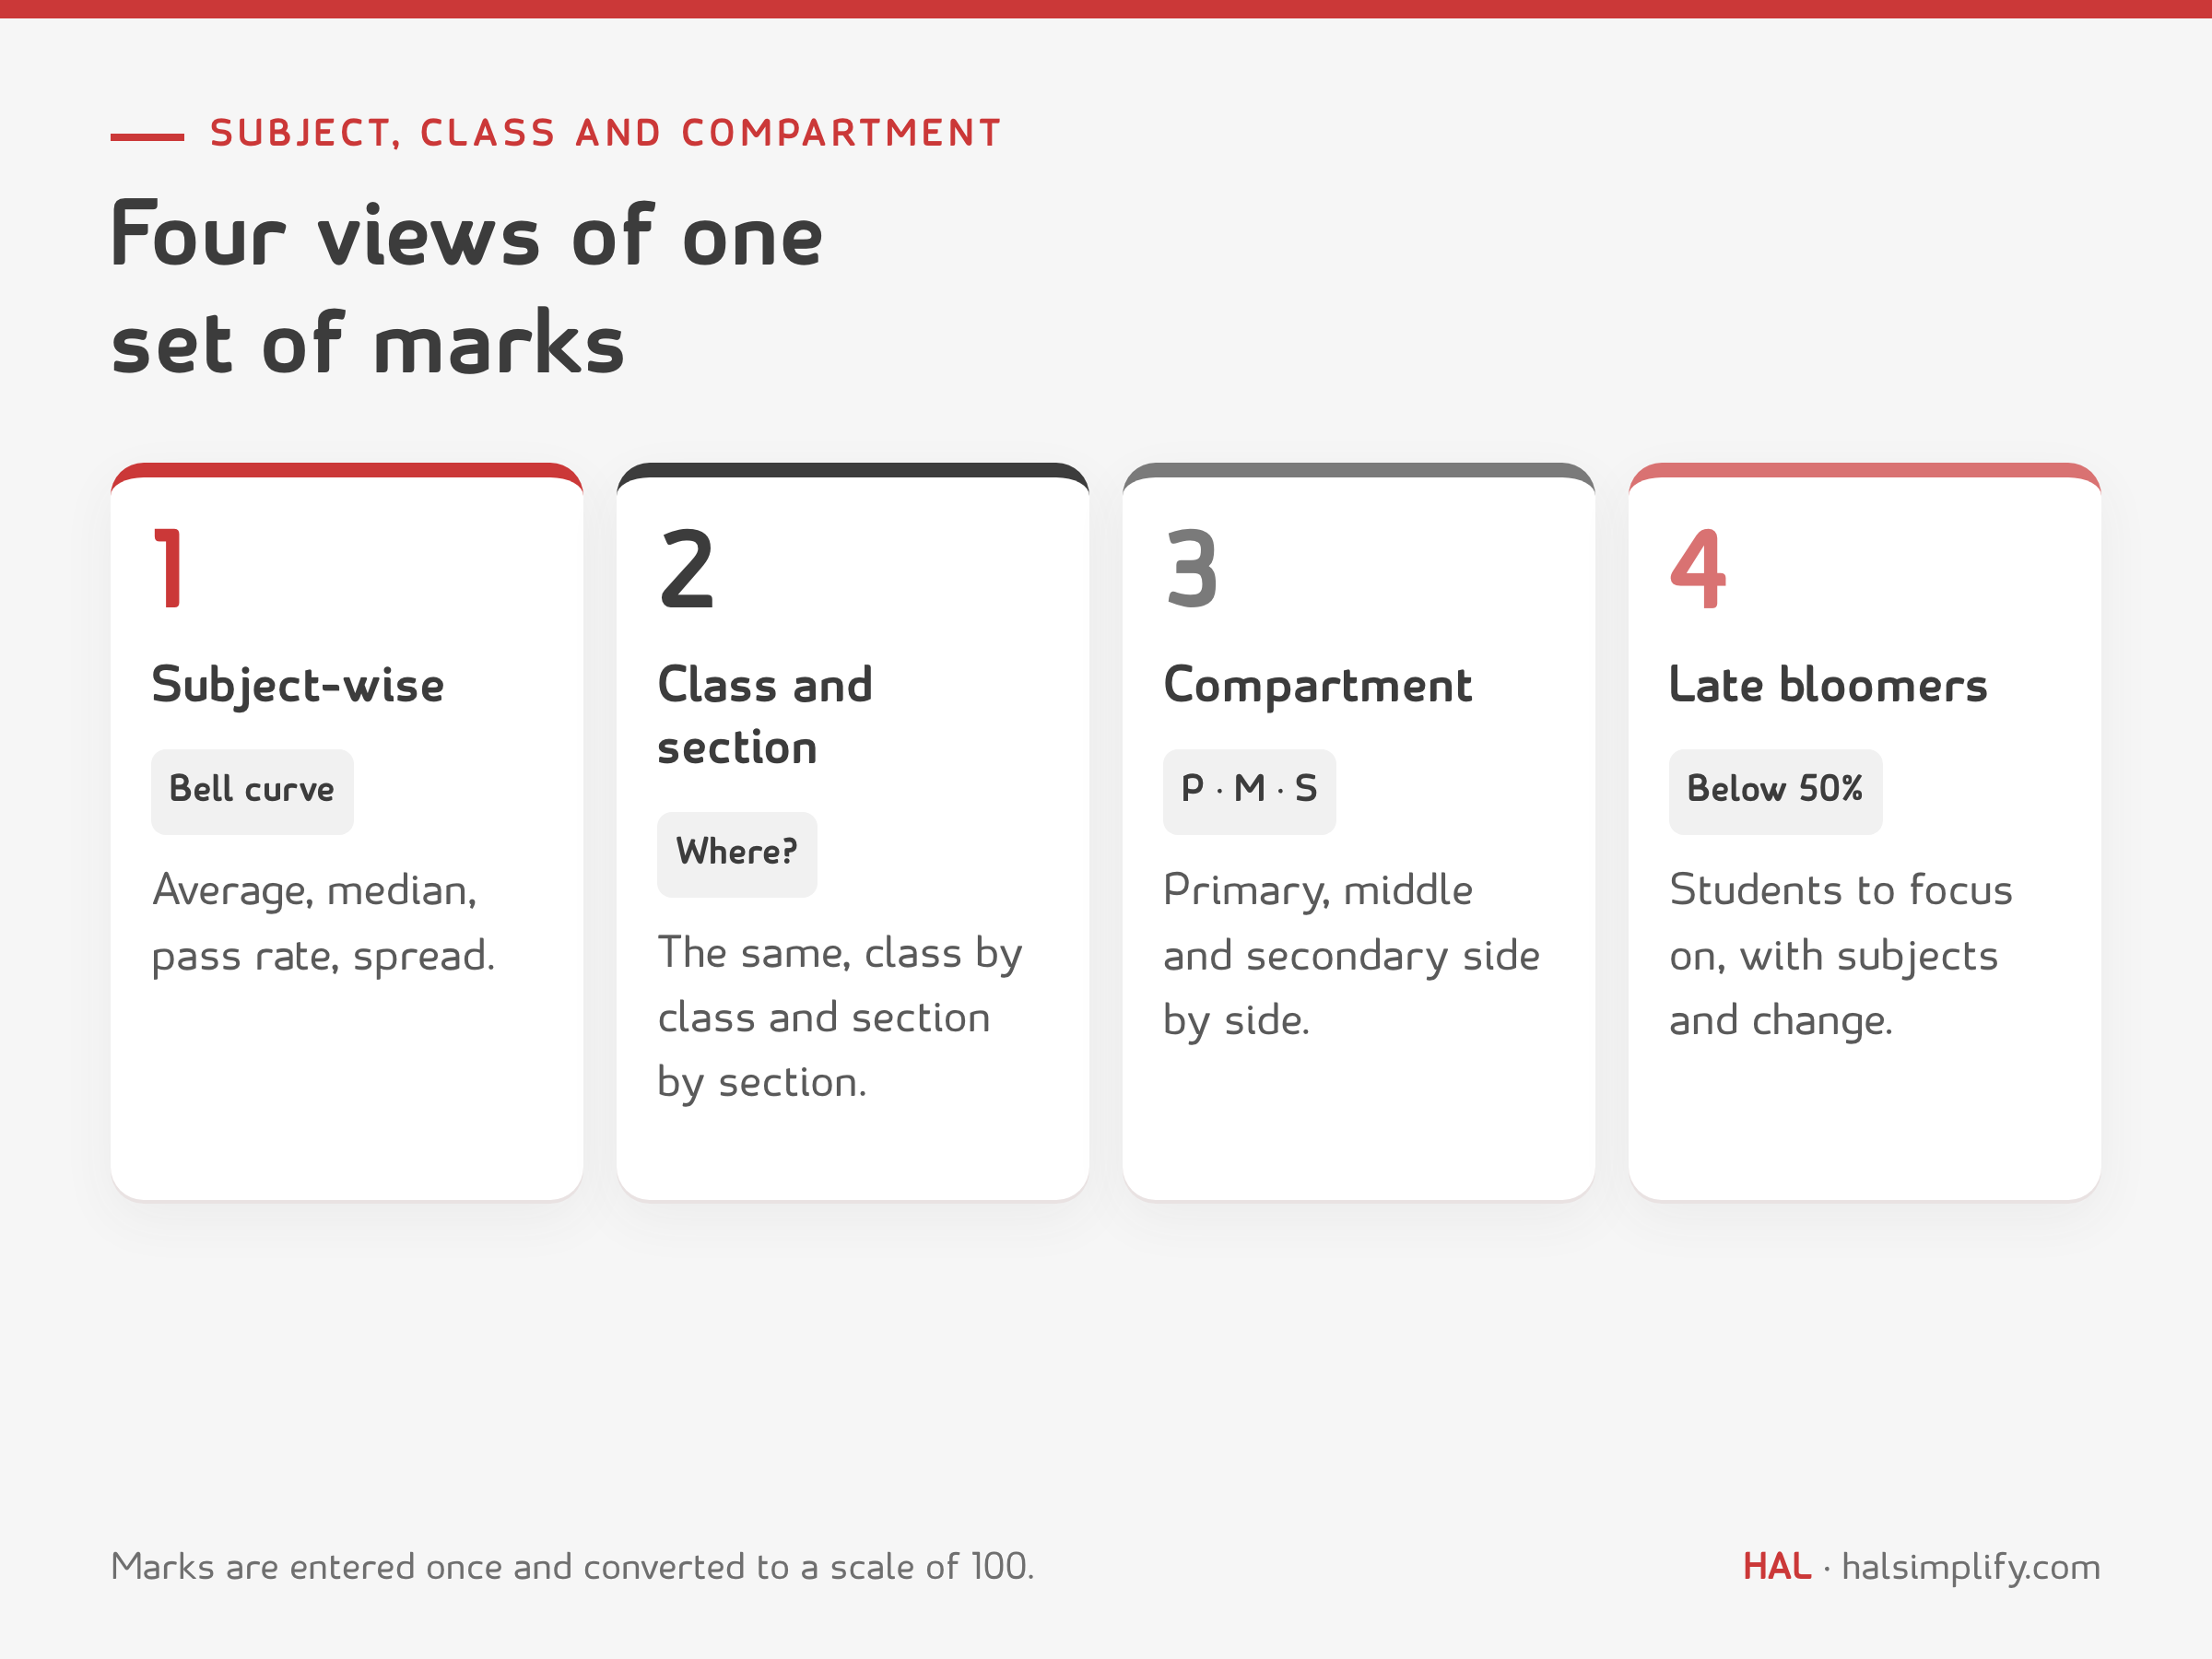
For each subject, the analysis shows the average, the median (the middle student), the highest and lowest marks, the pass rate and the number of students below the school's focus line.
It also shows the bell curve: a chart that counts students in mark bands, 0 to 9, 10 to 19, up to 90 to 100. The shape tells you more than the average.
The average says how the class did. The shape says who was in it.
The same measures, by class, and then by section within a class. If 8-A averages 62 in Mathematics and 8-B averages 33, the question for the head of department is useful and specific: what is different in 8-B? Timetable, teacher change, a topic taught late, a mix of students? The analysis does not answer that. It tells you where to ask.
Schools are usually run in compartments: primary (Classes 1 to 5), middle (6 to 8) and secondary (9 to 10). Each has a head. Comparing the three on average, pass rate and number below the focus line shows leadership where the system is under strain. The move from primary to middle is one place to look, and the data shows whether your school has a drop there.
A late bloomer here is a student whose average, or whose mark in a chosen subject, is below the focus line. We suggest 50% as the starting point. A school can set its own. For each student the list shows:
A student who is behind in marks is often behind in notebook checking and homework too, so one conversation and one next step can cover all three. A weak topic goes back to the lesson plan, as in the RISE lesson plan system.
The word is deliberate. A late bloomer is not a failure. It is a student who has not caught up yet, and the point of the list is that someone in the school knows their name and has agreed one thing to do.
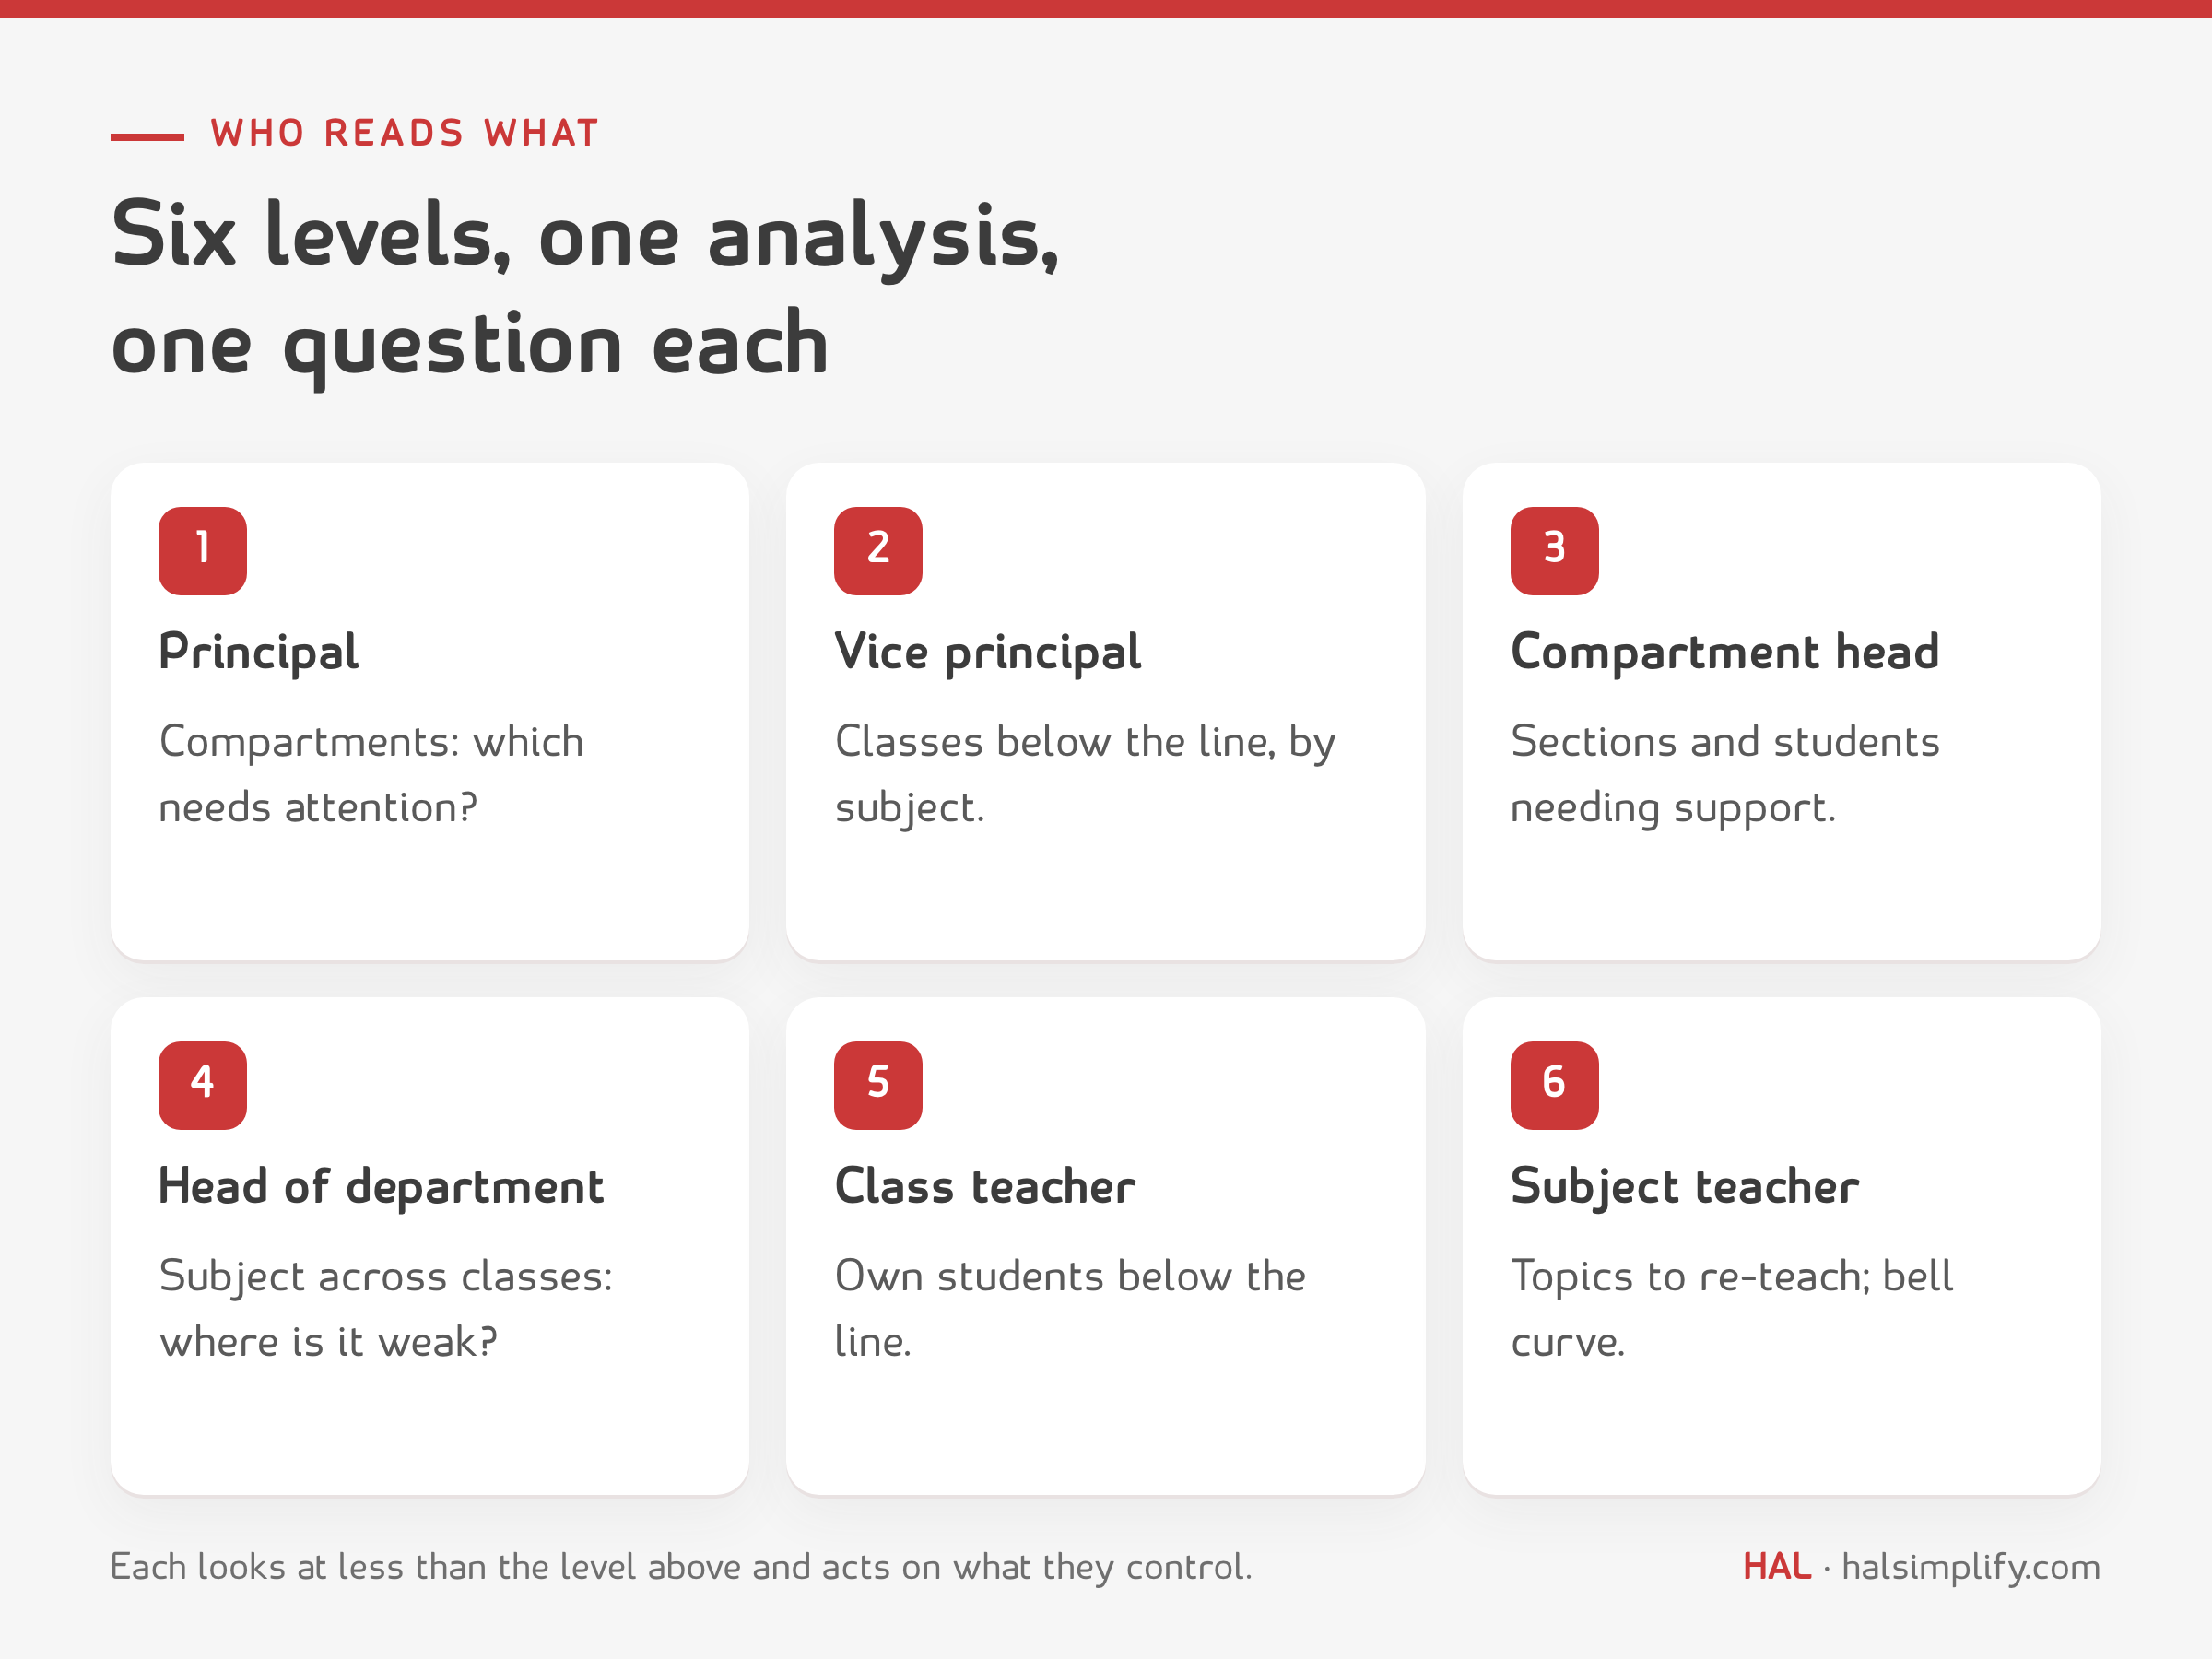
One analysis is read at six levels. Each level gets its own question and its own action.
| Who | Looks at | Asks | Acts |
|---|---|---|---|
| Principal | Compartment-wise and school pass rate | Which compartment needs attention this term? | Agrees priorities with the vice principal; reports to the board and parents |
| Vice principal | Class-wise across the school | Which classes are below the line, in which subjects? | Meets the compartment heads; asks for plans |
| Compartment head | Sections within the compartment; late bloomers | Which sections and students need support first? | Assigns support; reviews with class teachers |
| Head of department | Subject-wise across classes | Is the weakness in the subject or in one class? | Reviews lesson plans and the paper; supports the subject teacher |
| Class teacher | Own class; late bloomers | Which of my students are below the line, and in what? | Speaks to student and parent; agrees one target each |
| Subject teacher | Own subject and sections; bell curve | Which students and topics need re-teaching? | Re-teaches the topic; sets practice; rechecks at next test |
Each level looks at less than the one above and acts on something it controls.
The sample below belongs to a made-up school. The names and numbers are invented. It shows the filters a school leader would use: compartment, class, class with section and subject. Change a filter and every chart and table changes with it.
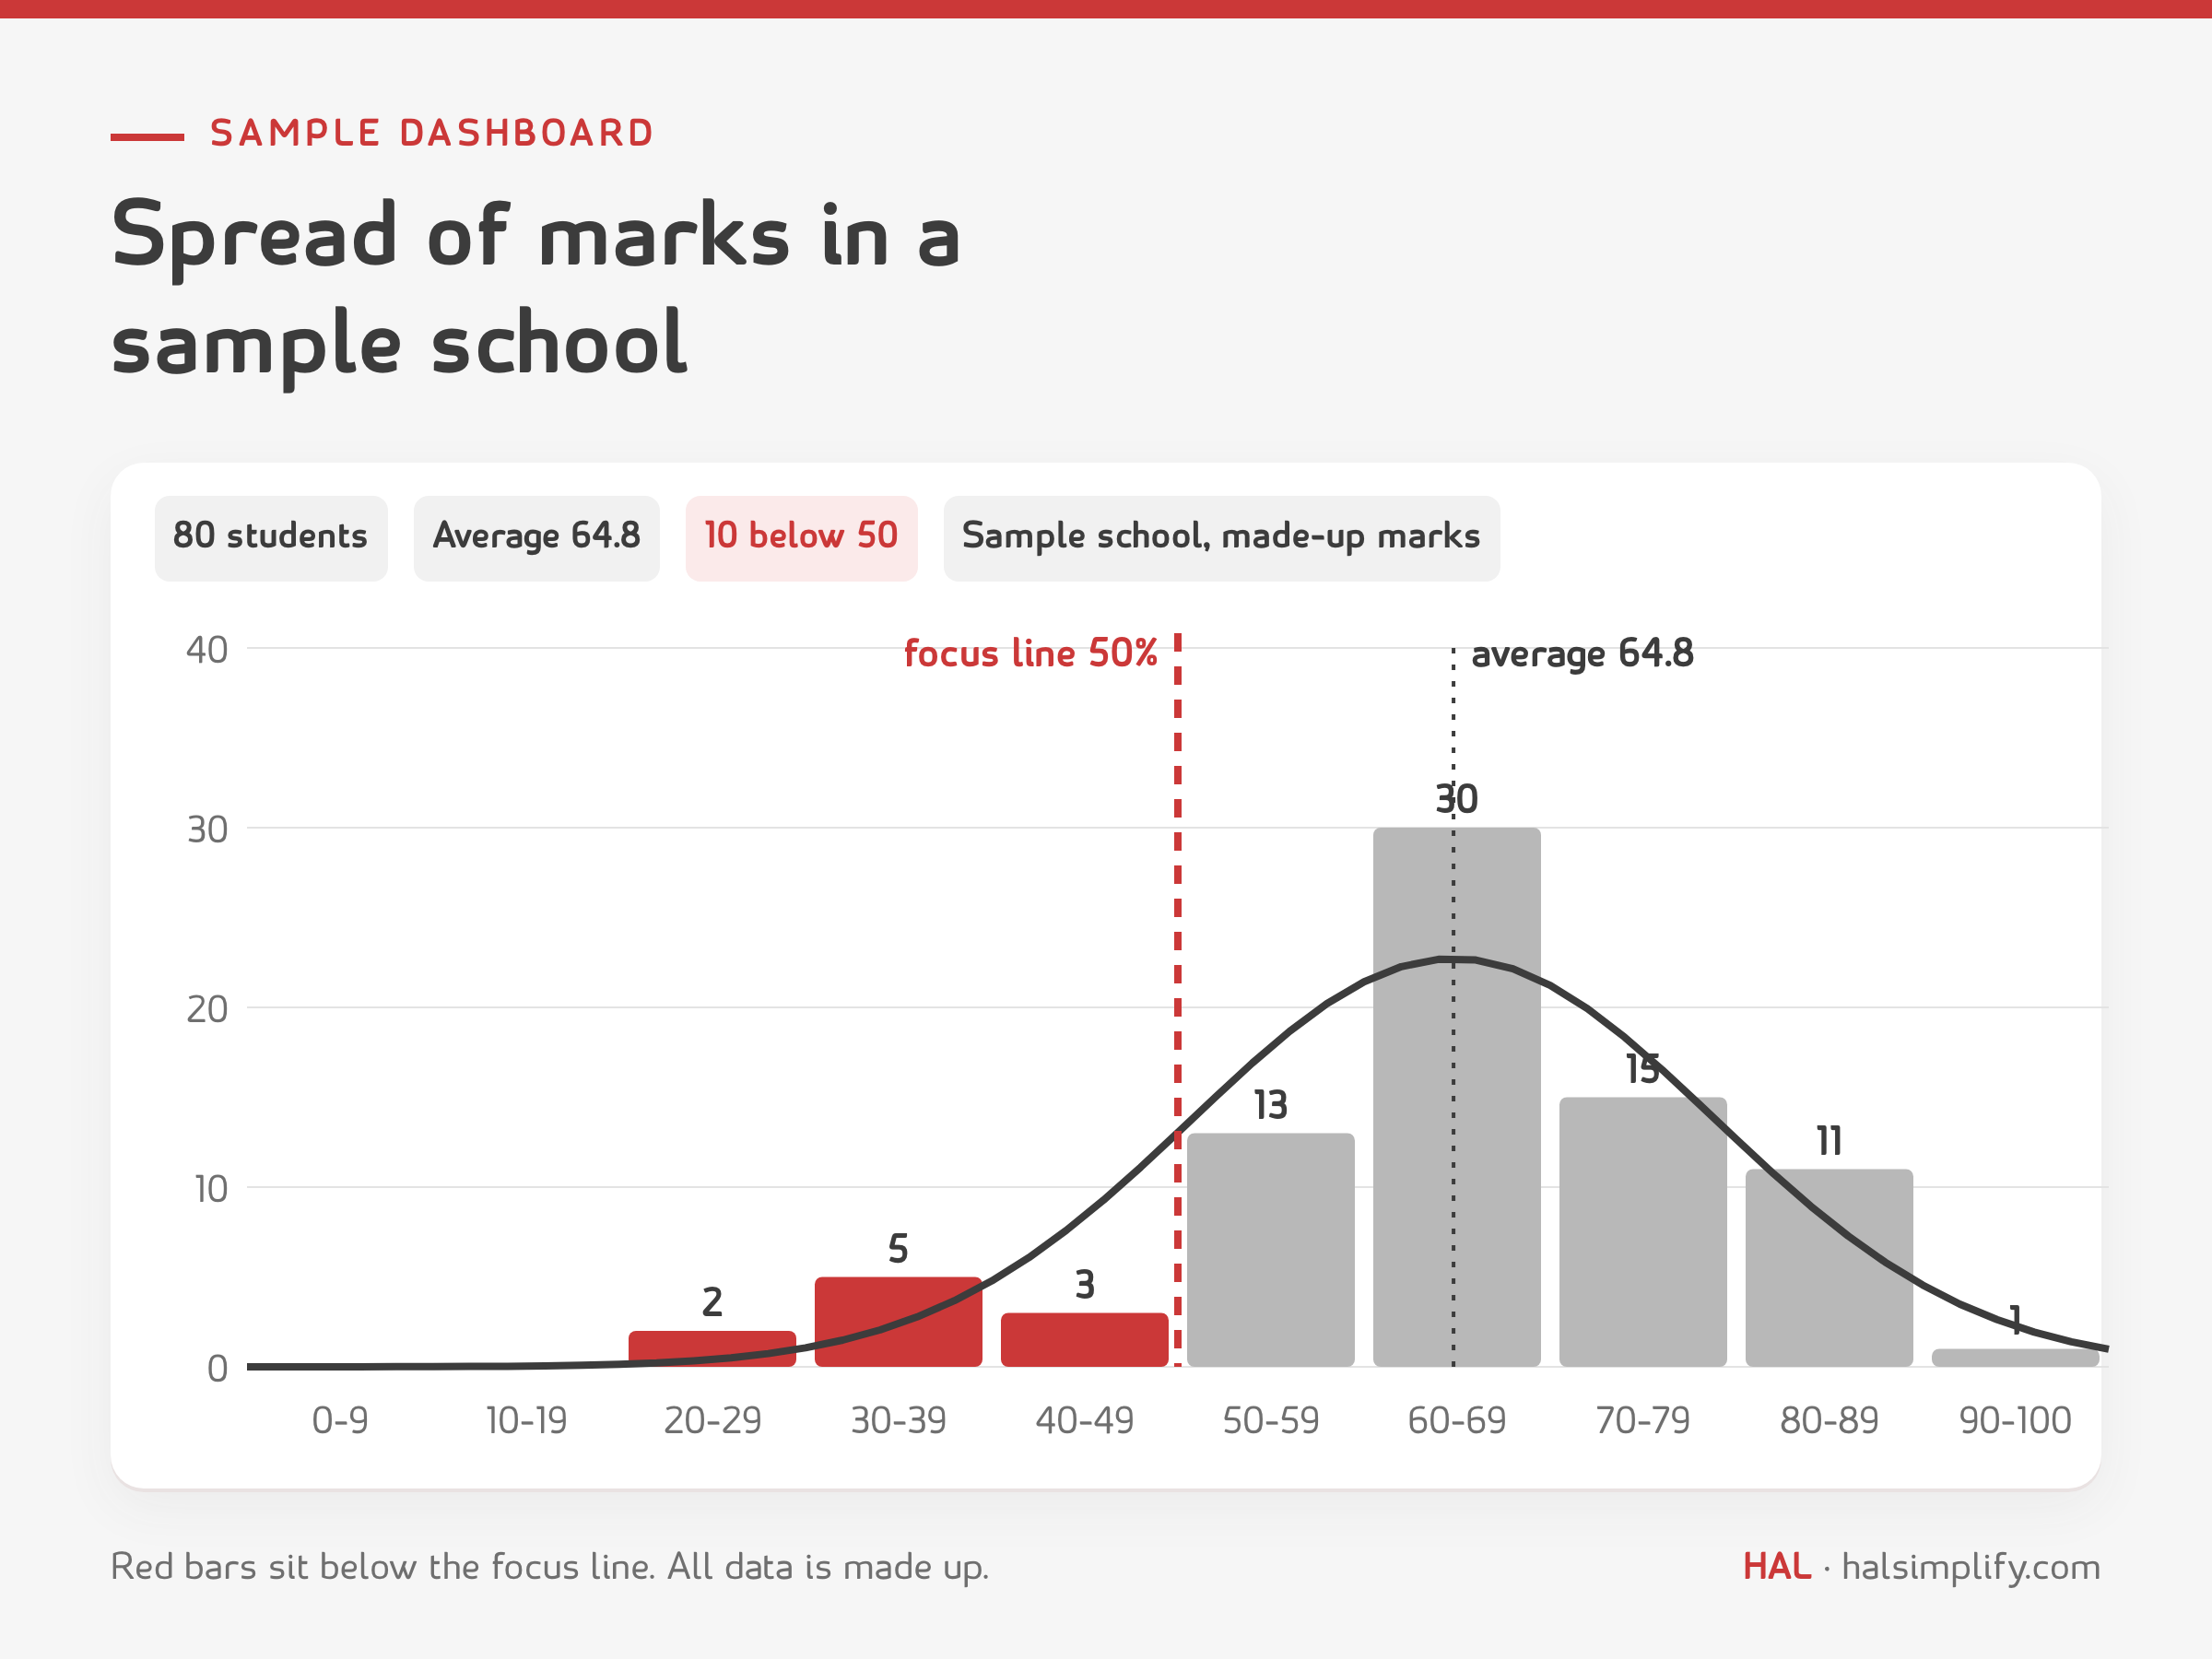
What to notice:
The mark entry screen feeds all of it. The subject teacher enters marks once, per class and subject. The converted mark and the grade are calculated, and everything else follows. HAL Edge, HAL's education management system, has a dedicated module for exam management and exam analysis. It is customizable and supports multiple boards, including IGCSE, Advanced, CBSE and the Philippine board, so grade bands, pass marks and report formats follow your board and your school.
Take the made-up Class 8 in the sample workbook, with sections 8-A and 8-B, and the Mathematics paper of the third periodic test.
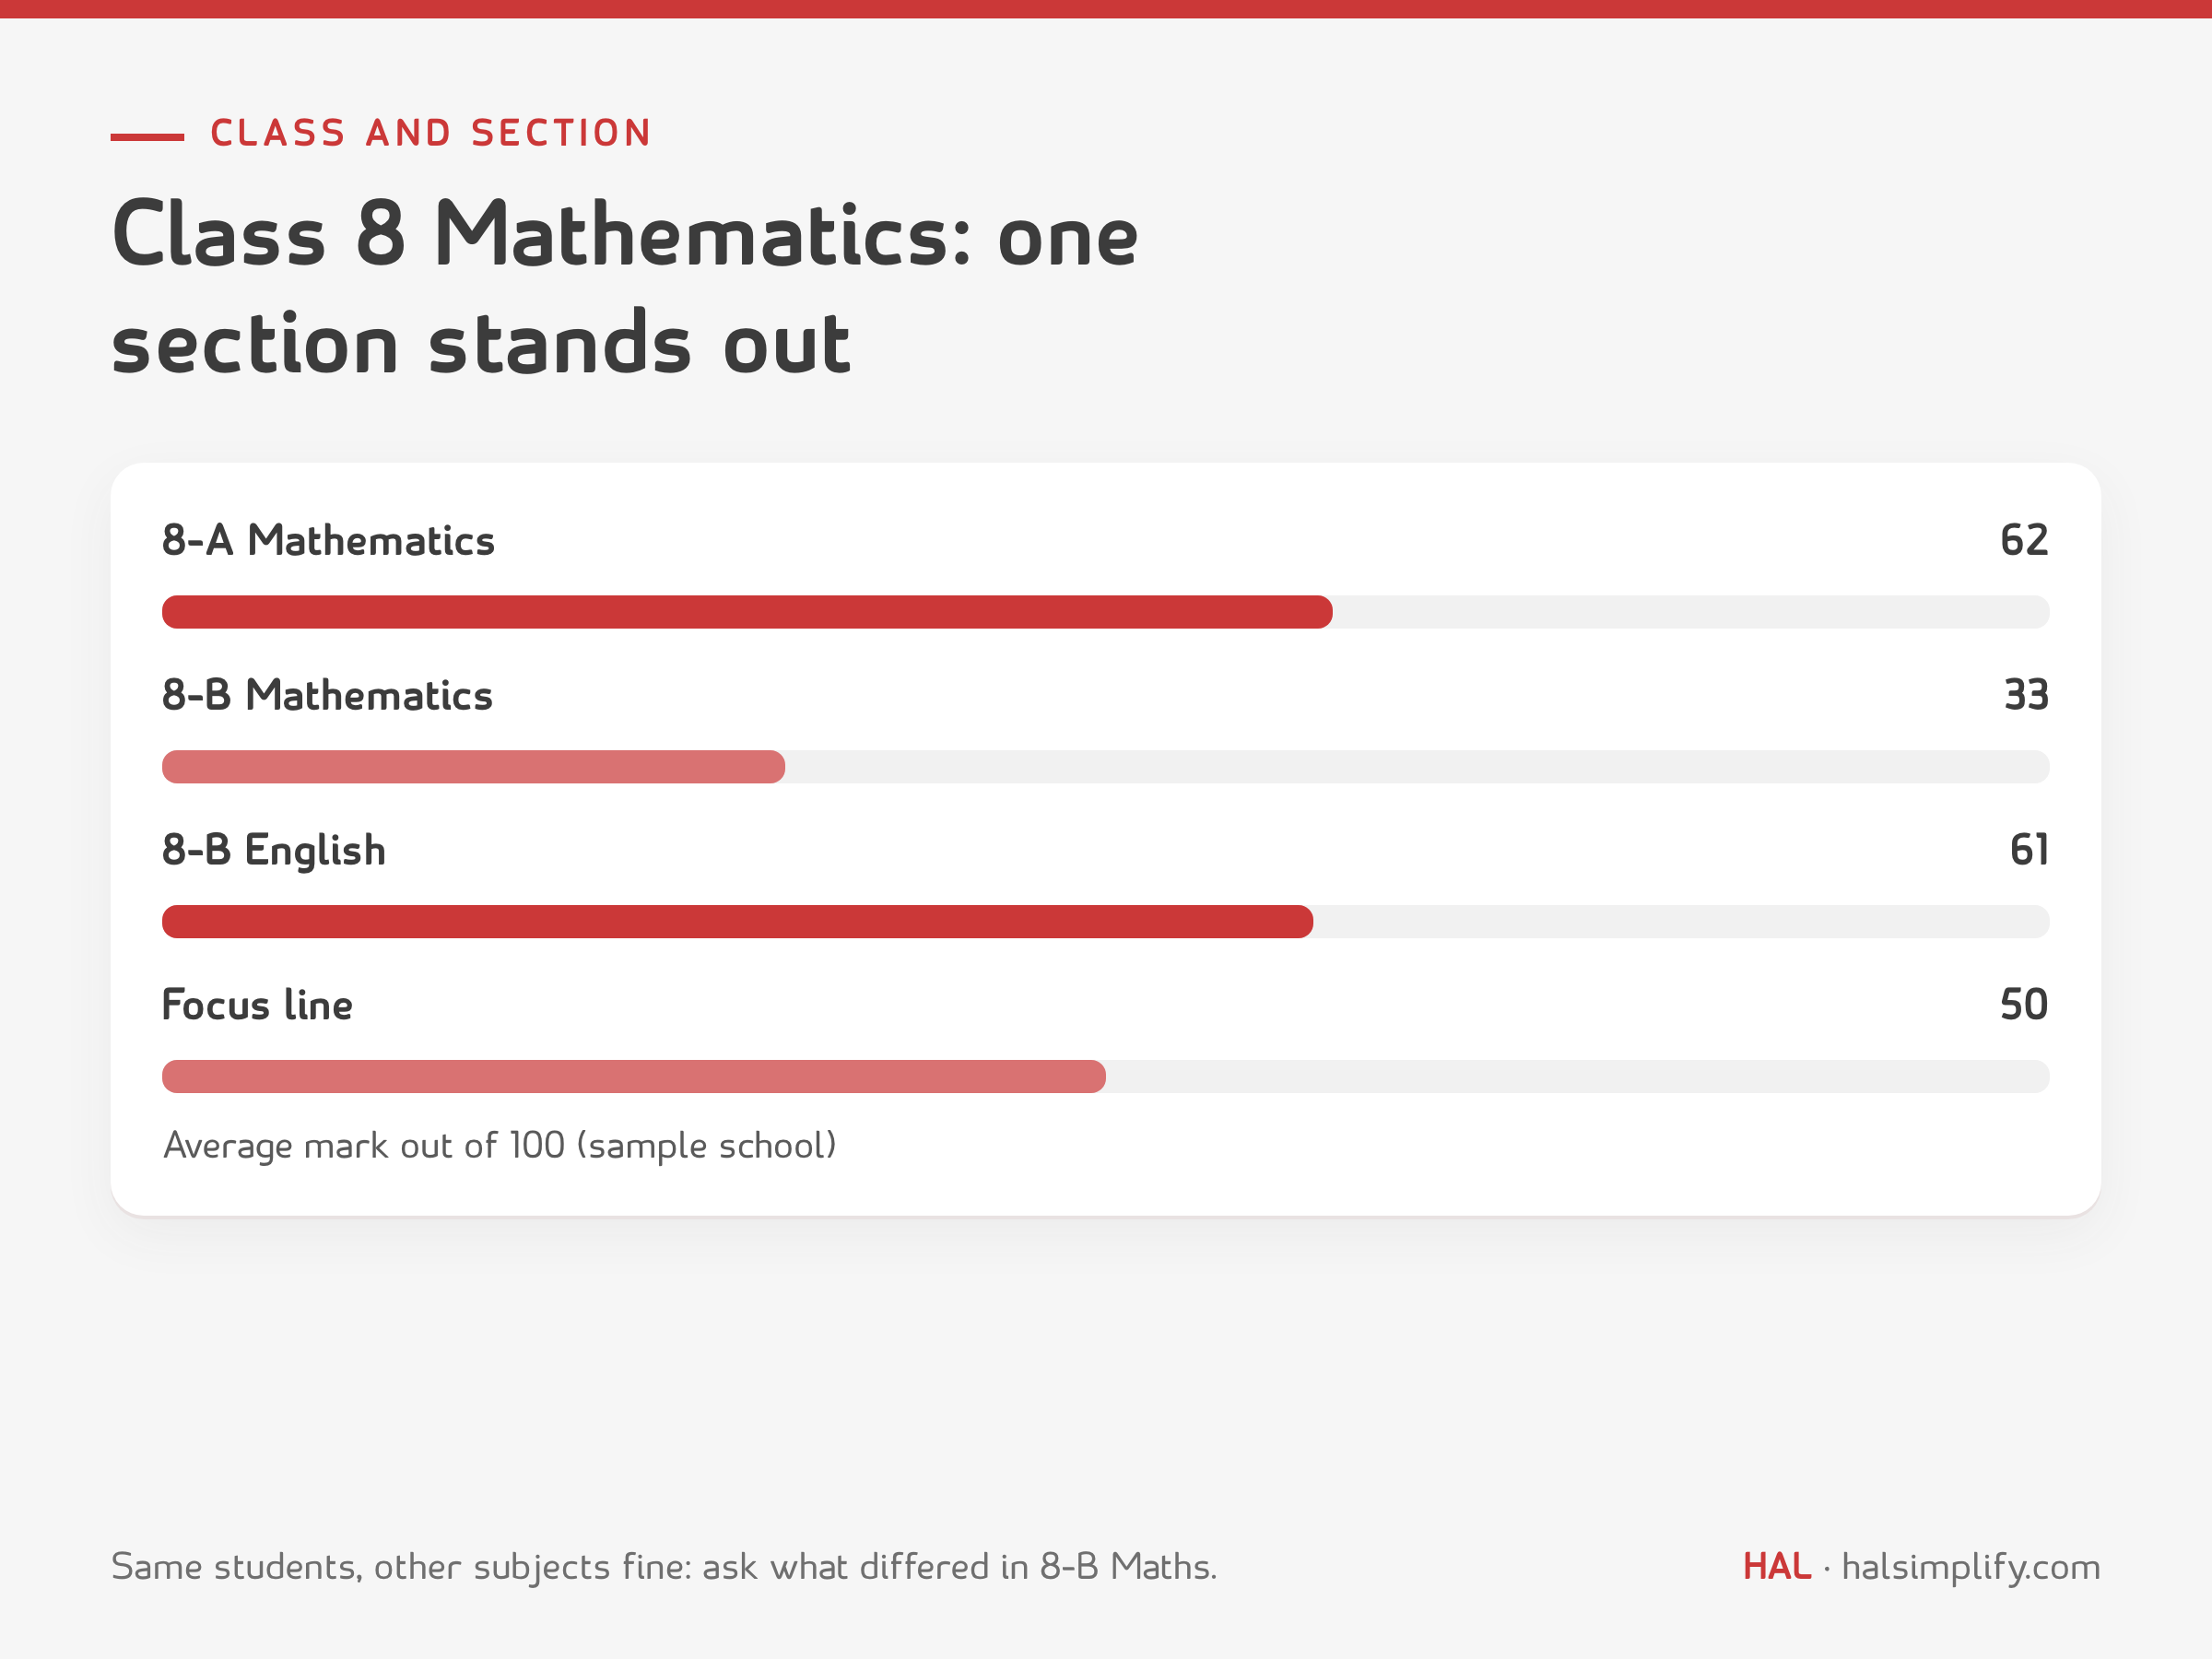
Nothing in these steps needed a meeting of the whole school. Each person looked at the view that fit their job.
Use school days, and adjust to your calendar.
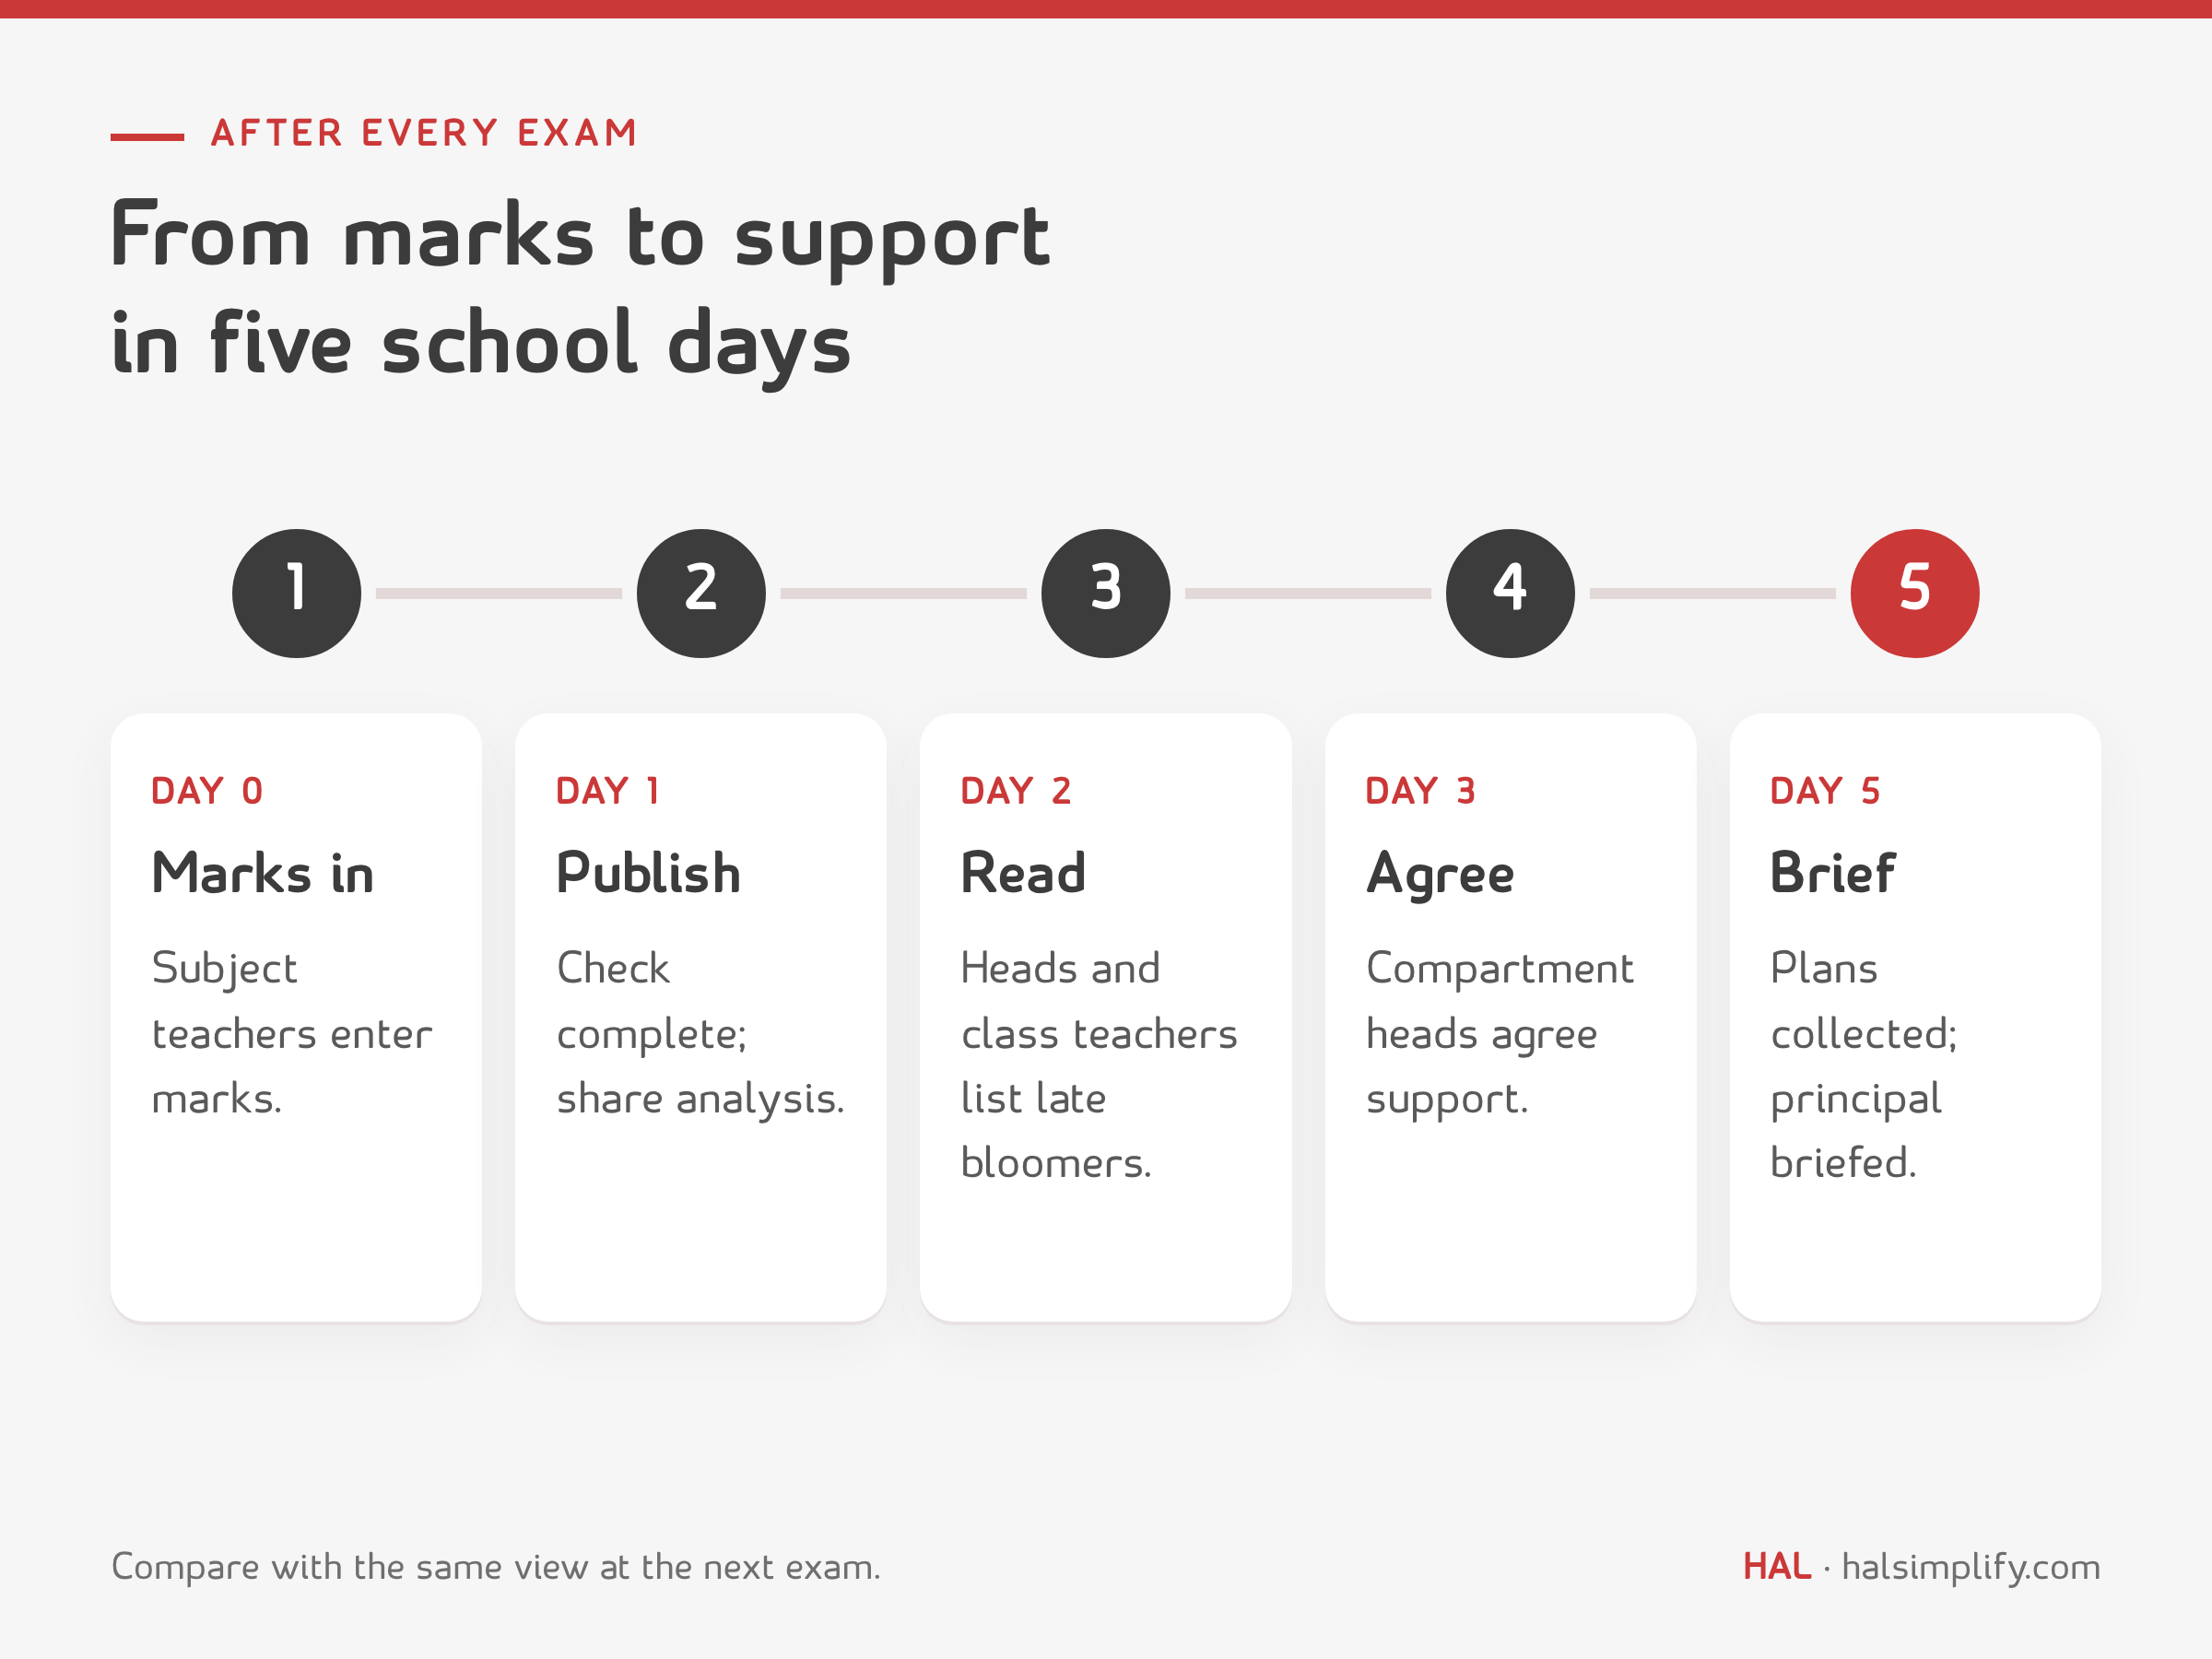
| When | Who | What |
|---|---|---|
| Day 0 (exam ends) | Subject teachers | Enter marks; the deadline is set by the vice principal |
| Day 1 | Exam coordinator | Check that every class and subject is complete; publish the analysis |
| Day 2 | Head of department and class teachers | Read their views; list late bloomers |
| Day 3 | Compartment heads | Review with class teachers; agree the support list |
| Day 5 | Vice principal | Collect plans; brief the principal |
| Next exam | Everyone | Compare with this one |
A short rule keeps it fair: compare a class with its own earlier tests and with similar groups. One test is a signal. Two or three in the same direction are a pattern.
Four cautions keep the analysis helpful.
The kit has two files.
Get the next routine in your inbox
One practical school routine a week, each with its free PDF guide and Excel tracker. Unsubscribe any time.
Exam analysis turns marks into information a school can act on. It shows the average and spread by subject, class and compartment, and lists the students who need support, so each person in the school knows where to focus.
Start with the average, the median, the pass rate and the number of students below a focus line, for each subject, class and section. Add the spread of marks as a bell curve, a compartment comparison and a list of late bloomers.
A chart that counts students in mark bands. Most students usually fall near the middle, with fewer at the top and bottom. The shape shows whether a class is moving together, has a group left behind or is made of two groups.
Everyone who can act on it, each with the view that fits their job: the principal sees compartments, the vice principal classes, heads of department subjects, class teachers their students and subject teachers their own marks and topics.
A student whose average or subject mark is below the school's focus line. This kit suggests 50% as a starting point. The list is there to give each student a named person and one agreed target, not to label the child.
Yes. The kit is a free download: a PDF guide and an Excel workbook that converts marks, builds the four views and lists late bloomers.